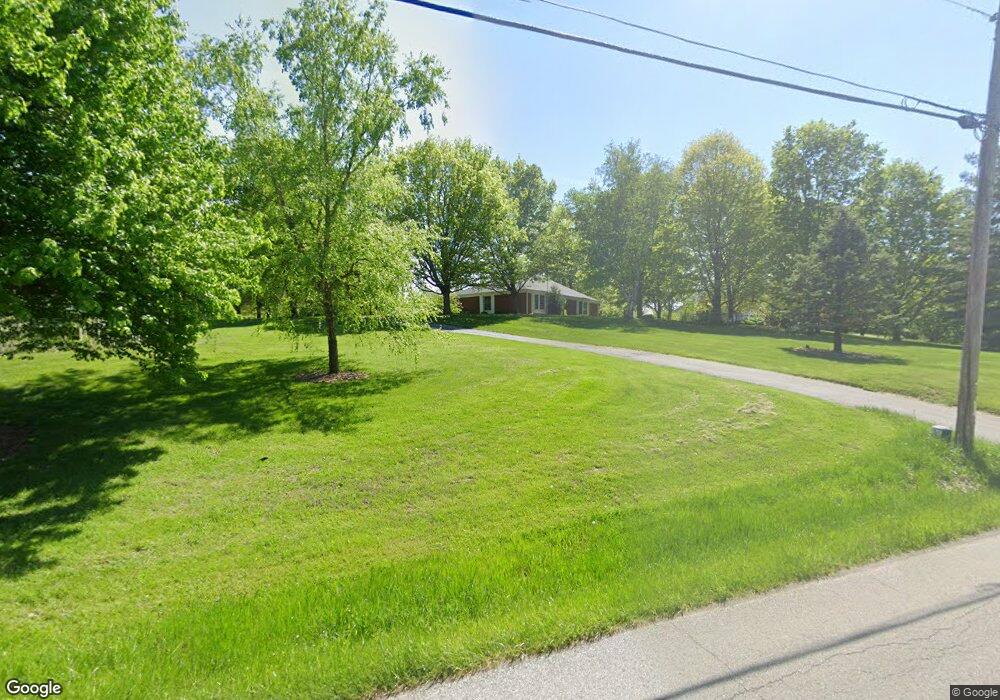
449 W Overlook Dr Upland, IN 46989
Estimated Value: $311,000 - $447,000
3
Beds
3
Baths
1,890
Sq Ft
$209/Sq Ft
Est. Value
About This Home
This home is located at 449 W Overlook Dr, Upland, IN 46989 and is currently estimated at $394,644, approximately $208 per square foot. 449 W Overlook Dr is a home located in Grant County.
Ownership History
Date
Name
Owned For
Owner Type
Purchase Details
Closed on
Aug 25, 1999
Sold by
Not Provided
Bought by
Not Provided
Current Estimated Value
Create a Home Valuation Report for This Property
The Home Valuation Report is an in-depth analysis detailing your home's value as well as a comparison with similar homes in the area
Home Values in the Area
Average Home Value in this Area
Purchase History
| Date | Buyer | Sale Price | Title Company |
|---|---|---|---|
| Not Provided | $155,000 | -- |
Source: Public Records
Tax History
| Year | Tax Paid | Tax Assessment Tax Assessment Total Assessment is a certain percentage of the fair market value that is determined by local assessors to be the total taxable value of land and additions on the property. | Land | Improvement |
|---|---|---|---|---|
| 2025 | $2,772 | $308,900 | $46,000 | $262,900 |
| 2024 | $2,772 | $306,400 | $46,400 | $260,000 |
| 2023 | $2,623 | $279,600 | $45,500 | $234,100 |
| 2022 | $2,727 | $255,400 | $45,900 | $209,500 |
| 2021 | $2,488 | $231,300 | $45,400 | $185,900 |
| 2020 | $2,218 | $220,900 | $43,400 | $177,500 |
| 2019 | $2,078 | $217,500 | $44,000 | $173,500 |
| 2018 | $1,790 | $205,300 | $40,500 | $164,800 |
| 2017 | $1,674 | $203,200 | $41,000 | $162,200 |
| 2016 | $1,616 | $204,400 | $41,300 | $163,100 |
| 2014 | $1,693 | $215,700 | $41,500 | $174,200 |
| 2013 | $1,693 | $205,500 | $40,800 | $164,700 |
Source: Public Records
Map
Nearby Homes
- 499 W Overlook Dr
- 575 W Overlook Dr
- 399 W Overlook Dr
- 355 W Overlook Dr
- 299 W Overlook Dr
- 243 W Overlook Dr
- 661 W Overlook Dr
- 211 W Overlook Dr
- 749 W Overlook Dr
- 0 E 700 S Unit 201817231
- 0 E 700 S Unit 21316914
- 0 E 700 S Unit 22825240
- 0 E 700 S Unit MBR21997838
- 0 E 700 S Unit 202432252
- 0 E 700 S Unit 802551
- 241 Anson St
- 8994 E 700 S
- 6360 S 900 E
- 8964 E 700 S
- 1050 E 700 S
Your Personal Tour Guide
Ask me questions while you tour the home.