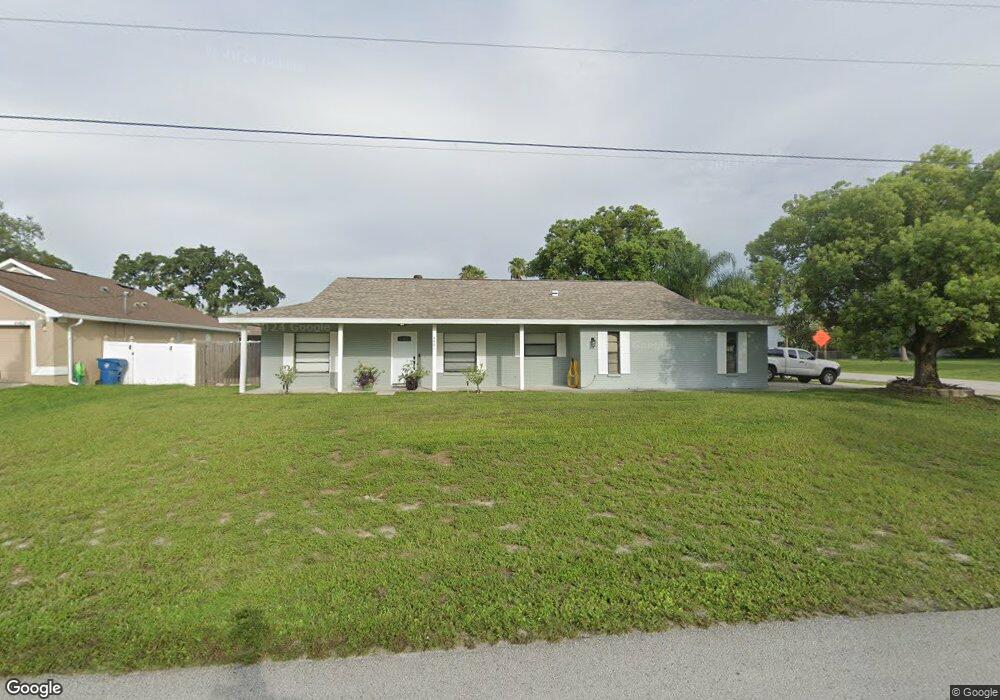
4491 Tiburon Ave Spring Hill, FL 34608
Estimated Value: $332,000 - $386,000
3
Beds
3
Baths
1,952
Sq Ft
$179/Sq Ft
Est. Value
About This Home
This home is located at 4491 Tiburon Ave, Spring Hill, FL 34608 and is currently estimated at $350,038, approximately $179 per square foot. 4491 Tiburon Ave is a home located in Hernando County with nearby schools including Explorer K-8, Frank W. Springstead High School, and Gulf Coast Elementary School.
Ownership History
Date
Name
Owned For
Owner Type
Purchase Details
Closed on
Jul 20, 2022
Sold by
Vonschmidt Joseph L and Vonschmidt Denise
Bought by
Vonschmidt Thomas and Vonschmidt Jenna
Current Estimated Value
Home Financials for this Owner
Home Financials are based on the most recent Mortgage that was taken out on this home.
Original Mortgage
$197,962
Outstanding Balance
$189,459
Interest Rate
5.81%
Mortgage Type
FHA
Estimated Equity
$160,579
Purchase Details
Closed on
Feb 21, 1997
Sold by
Cancilla Anna and Cancilla Salvatore
Bought by
Vonschmidt Joseph L and Vonschmidt Denise
Home Financials for this Owner
Home Financials are based on the most recent Mortgage that was taken out on this home.
Original Mortgage
$82,600
Interest Rate
7.91%
Purchase Details
Closed on
Jan 20, 1997
Sold by
Gallahan Cheryl
Bought by
Cancilla Anna and Cancilla Salvatore
Home Financials for this Owner
Home Financials are based on the most recent Mortgage that was taken out on this home.
Original Mortgage
$82,600
Interest Rate
7.91%
Create a Home Valuation Report for This Property
The Home Valuation Report is an in-depth analysis detailing your home's value as well as a comparison with similar homes in the area
Home Values in the Area
Average Home Value in this Area
Purchase History
| Date | Buyer | Sale Price | Title Company |
|---|---|---|---|
| Vonschmidt Thomas | $280,583 | None Listed On Document | |
| Vonschmidt Joseph L | $87,000 | -- | |
| Cancilla Anna | -- | -- |
Source: Public Records
Mortgage History
| Date | Status | Borrower | Loan Amount |
|---|---|---|---|
| Open | Vonschmidt Thomas | $197,962 | |
| Previous Owner | Vonschmidt Joseph L | $82,600 |
Source: Public Records
Tax History Compared to Growth
Tax History
| Year | Tax Paid | Tax Assessment Tax Assessment Total Assessment is a certain percentage of the fair market value that is determined by local assessors to be the total taxable value of land and additions on the property. | Land | Improvement |
|---|---|---|---|---|
| 2024 | $4,975 | $289,847 | $45,136 | $244,711 |
| 2023 | $4,975 | $286,472 | $44,518 | $241,954 |
| 2022 | $1,466 | $98,207 | $0 | $0 |
| 2021 | $914 | $95,347 | $0 | $0 |
| 2020 | $3,821 | $94,031 | $0 | $0 |
| 2019 | $1,341 | $91,917 | $0 | $0 |
| 2018 | $776 | $90,203 | $0 | $0 |
| 2017 | $1,046 | $88,348 | $0 | $0 |
| 2016 | $1,009 | $86,531 | $0 | $0 |
| 2015 | $1,011 | $85,929 | $0 | $0 |
| 2014 | $990 | $85,247 | $0 | $0 |
Source: Public Records
Map
Nearby Homes
- 0 Timbercrest Rd Unit OM531168
- 4476 Azora Rd
- 4380 Azora Rd
- 10281 Clyburn St Unit Lot 10281
- 4413 Tioga Ave
- 4436 Azora Rd
- 4225 Jason Rd
- 4480 Abagail Dr
- 4330 Union Springs Rd
- 10315 Thornberry Dr
- 10056 Gifford Dr
- 3463 Jason Rd
- 10386 Norvell Rd
- 5092 Abagail Dr
- 4535 Augustine Rd
- 1103 Timbercrest Rd
- 10405 Timbercrest Rd
- 10475 Norvell Rd
- 0 Jason Rd
- 5339 Keysville Ave
- 4467 Tiburon Ave
- 2515 Landover Blvd
- 2523 Landover Blvd
- 4493 Tiburon Ave
- 4459 Tiburon Ave
- 10352 Timbercrest Rd
- 2499 Landover Blvd
- 2531 Landover Blvd
- 4451 Tiburon Ave
- 4490 Tiburon Ave
- 4499 Tiburon Ave
- 2539 Landover Blvd
- 10364 Timbercrest Rd
- 2491 Landover Blvd
- 10365 Timbercrest (Sh U 17 B Rd
- 2516 Landover Blvd
- 2508 Landover Blvd
- 4500 Tiburon Ave
- 4443 Tiburon Ave
- 2524 Landover Blvd