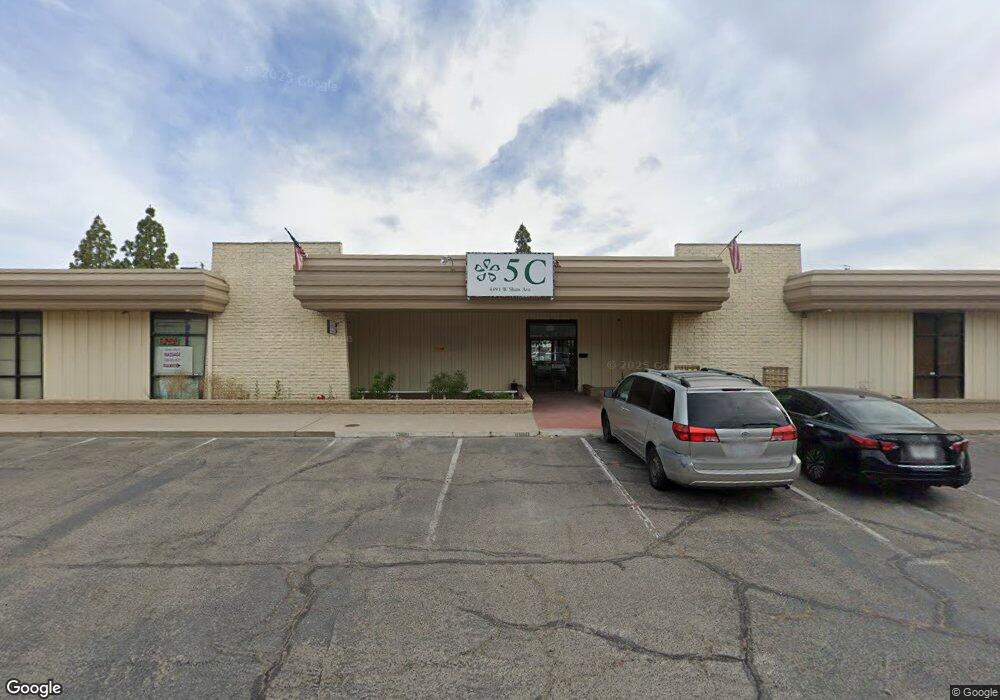
4491 W Shaw Ave Unit 101 Fresno, CA 93722
Bullard NeighborhoodEstimated Value: $2,013,730
--
Bed
--
Bath
8,939
Sq Ft
$225/Sq Ft
Est. Value
About This Home
This home is located at 4491 W Shaw Ave Unit 101, Fresno, CA 93722 and is currently priced at $2,013,730, approximately $225 per square foot. 4491 W Shaw Ave Unit 101 is a home located in Fresno County with nearby schools including Slater Elementary School, Bullard High School, and Aspen Valley Prep Academy.
Ownership History
Date
Name
Owned For
Owner Type
Purchase Details
Closed on
Nov 14, 2024
Sold by
5C Construction Development & Management
Bought by
Surf Thru Inc
Current Estimated Value
Purchase Details
Closed on
Mar 8, 2019
Sold by
1St Continental Mortgage Starrr Inc
Bought by
5C Construction Development & Mgmt Inc
Purchase Details
Closed on
Nov 16, 2015
Sold by
Starr Funding Inc
Bought by
1St Continental Mortgage Starrr Inc
Purchase Details
Closed on
Jun 30, 2009
Sold by
1-5 Social Services Corporation Inc
Bought by
Starrr Fundings Inc
Home Financials for this Owner
Home Financials are based on the most recent Mortgage that was taken out on this home.
Original Mortgage
$650,000
Interest Rate
5.08%
Mortgage Type
Future Advance Clause Open End Mortgage
Purchase Details
Closed on
Mar 12, 2007
Sold by
1 5 Social Services Corp Inc
Bought by
1 5 Social Services Corp Inc
Create a Home Valuation Report for This Property
The Home Valuation Report is an in-depth analysis detailing your home's value as well as a comparison with similar homes in the area
Home Values in the Area
Average Home Value in this Area
Purchase History
| Date | Buyer | Sale Price | Title Company |
|---|---|---|---|
| Surf Thru Inc | $2,200,000 | Chicago Title | |
| 5C Construction Development & Mgmt Inc | -- | None Available | |
| 5C Construction Development & Mgmt Inc | -- | None Available | |
| 1St Continental Mortgage Starrr Inc | -- | None Available | |
| Starrr Fundings Inc | $750,000 | Stewart Title Of California | |
| 1 5 Social Services Corp Inc | -- | Stewart Title Of California |
Source: Public Records
Mortgage History
| Date | Status | Borrower | Loan Amount |
|---|---|---|---|
| Previous Owner | Starrr Fundings Inc | $650,000 |
Source: Public Records
Tax History Compared to Growth
Tax History
| Year | Tax Paid | Tax Assessment Tax Assessment Total Assessment is a certain percentage of the fair market value that is determined by local assessors to be the total taxable value of land and additions on the property. | Land | Improvement |
|---|---|---|---|---|
| 2025 | $11,893 | $836,635 | $161,748 | $674,887 |
| 2023 | $11,893 | $804,149 | $155,468 | $648,681 |
| 2022 | $10,490 | $788,382 | $152,420 | $635,962 |
| 2021 | $9,929 | $772,925 | $149,432 | $623,493 |
| 2020 | $9,886 | $765,000 | $147,900 | $617,100 |
| 2019 | $7,103 | $557,133 | $127,344 | $429,789 |
| 2018 | $6,951 | $546,210 | $124,848 | $421,362 |
| 2017 | $6,833 | $535,500 | $122,400 | $413,100 |
| 2016 | $6,679 | $530,500 | $120,000 | $410,500 |
| 2015 | $6,670 | $530,000 | $120,000 | $410,000 |
| 2014 | $6,603 | $525,000 | $120,000 | $405,000 |
Source: Public Records
Map
Nearby Homes
- 6317 N Alta Vista Ln
- 5319 N San Marcos Ave
- 5334 N Gates Ave
- 4531 W Malibu Ave
- 123 Cornelia Ave
- 5432 N Salinas Ave
- 4171 W Avalon Ave
- 4717 W Joline Dr
- 4402 W Langden Dr Unit Lot19
- 4062 W San Jose Ave
- 4286 N Parkway Dr
- 4430 W Langden Dr
- 4422 W Langden Dr Unit Lot14
- 4473 W Langden Dr
- 5069 W Mission Ave
- 5071 W Mission Ave
- 5227 W Mission Ave
- 4129 W Regency Ave
- 4435 N Cornelia Ave
- 4508 W Holland Ave
- 4491 W Shaw Ave Unit 120
- 4491 W Shaw Ave
- 4434 W Shaw Ave
- 4386 W Shaw Ave
- 4382 W Shaw Ave
- 4460 W Shaw Ave Unit 196
- 4368 W Shaw Ave
- 4325 W Shaw Ave
- 4645 N Blythe Ave
- 6348 N Santa Lucia Way
- 6318 N Santa Lucia Way
- 6387 N Santa Lucia Way
- 6357 N Santa Lucia Way
- 6354 N Santa Lucia Way
- 6393 N Santa Lucia Way
- 6381 N Santa Lucia Way
- 6366 N Santa Lucia Way
- 6330 N Santa Lucia Way
- 6372 N Santa Lucia Way
- 6360 N Santa Lucia Way