4492 W 57th St Cleveland, OH 44144
Old Brooklyn NeighborhoodEstimated Value: $140,655 - $190,000
3
Beds
1
Bath
1,131
Sq Ft
$151/Sq Ft
Est. Value
About This Home
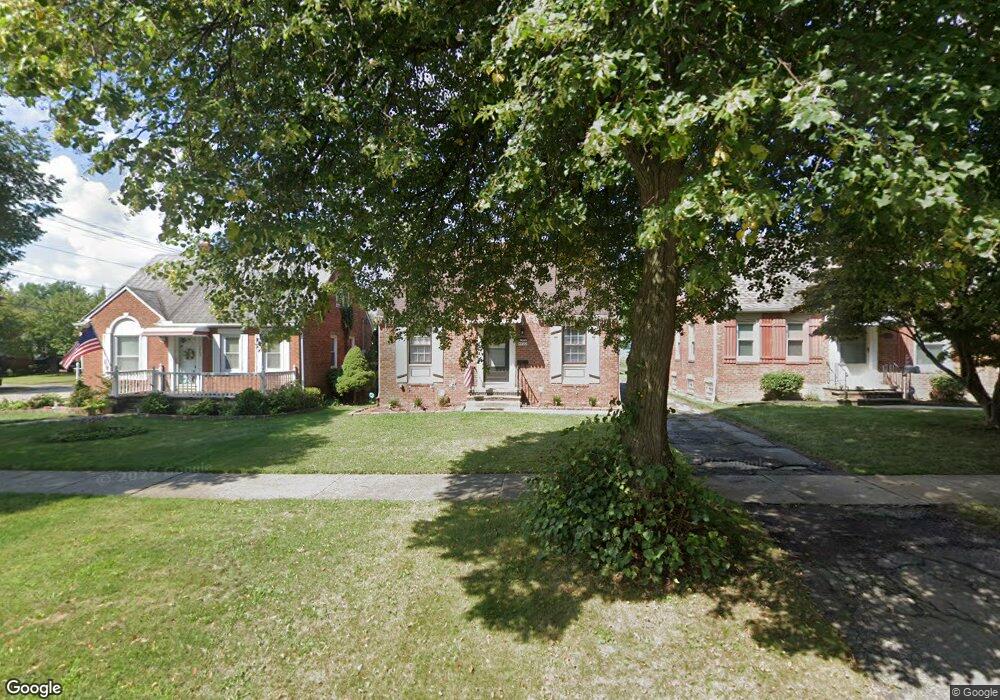
This home is located at 4492 W 57th St, Cleveland, OH 44144 and is currently estimated at $170,914, approximately $151 per square foot. 4492 W 57th St is a home located in Cuyahoga County with nearby schools including Benjamin Franklin, Almira Academy, and Artemus Ward School.
Ownership History
Date
Name
Owned For
Owner Type
Purchase Details
Closed on
Jul 17, 2014
Sold by
Deflorville Raymond J and Deflorville Raymond T
Bought by
Spurgeon Brian J
Current Estimated Value
Purchase Details
Closed on
Jun 8, 1998
Sold by
Reeve Martha A and Pawnyk Martha A
Bought by
Deflorville Raymond T
Home Financials for this Owner
Home Financials are based on the most recent Mortgage that was taken out on this home.
Original Mortgage
$91,411
Interest Rate
7.27%
Mortgage Type
FHA
Purchase Details
Closed on
Dec 20, 1989
Sold by
Malec Joseph E
Bought by
Reeve Martha A
Purchase Details
Closed on
Feb 27, 1987
Sold by
Kastranek Lynne L
Bought by
Bart Lynne L
Purchase Details
Closed on
Mar 12, 1980
Sold by
Kenney Kevein T
Bought by
Kastranek Lynne L
Purchase Details
Closed on
Aug 24, 1978
Sold by
Kovach Steve L and Kovach Margaret
Bought by
Kenney Kevein T
Purchase Details
Closed on
Jan 1, 1975
Bought by
Kovach Steve L and Kovach Margaret
Create a Home Valuation Report for This Property
The Home Valuation Report is an in-depth analysis detailing your home's value as well as a comparison with similar homes in the area
Home Values in the Area
Average Home Value in this Area
Purchase History
| Date | Buyer | Sale Price | Title Company |
|---|---|---|---|
| Spurgeon Brian J | $28,000 | None Available | |
| Deflorville Raymond T | $91,500 | -- | |
| Reeve Martha A | $55,900 | -- | |
| Bart Lynne L | -- | -- | |
| Kastranek Lynne L | -- | -- | |
| Kenney Kevein T | $42,000 | -- | |
| Kovach Steve L | -- | -- |
Source: Public Records
Mortgage History
| Date | Status | Borrower | Loan Amount |
|---|---|---|---|
| Previous Owner | Deflorville Raymond T | $91,411 |
Source: Public Records
Tax History Compared to Growth
Tax History
| Year | Tax Paid | Tax Assessment Tax Assessment Total Assessment is a certain percentage of the fair market value that is determined by local assessors to be the total taxable value of land and additions on the property. | Land | Improvement |
|---|---|---|---|---|
| 2024 | $2,965 | $44,345 | $8,995 | $35,350 |
| 2023 | $2,382 | $30,730 | $6,440 | $24,290 |
| 2022 | $2,369 | $30,730 | $6,440 | $24,290 |
| 2021 | $2,347 | $30,730 | $6,440 | $24,290 |
| 2020 | $2,106 | $23,840 | $5,010 | $18,830 |
| 2019 | $1,950 | $68,100 | $14,300 | $53,800 |
| 2018 | $1,913 | $23,840 | $5,010 | $18,830 |
| 2017 | $1,897 | $22,440 | $4,340 | $18,100 |
| 2016 | $1,883 | $22,440 | $4,340 | $18,100 |
| 2015 | $2,046 | $22,440 | $4,340 | $18,100 |
| 2014 | $2,046 | $24,920 | $4,830 | $20,090 |
Source: Public Records
Map
Nearby Homes
- 4484 W 53rd St
- 5105 Behrwald Ave
- 5714 Stickney Ave
- 4456 W 49th St
- 5701 Stickney Ave
- 4373 W 52nd St
- 4811 Ardmore Ave
- 4427 W 49th St
- 6015 Ira Ave
- 5902 Vandalia Ave
- 4615 Ardmore Ave
- 4520 Wichita Ave
- 4510 Woburn Ave
- 4329 Ardmore Ave
- 4215 W 58th St
- 7420 Outlook Ave
- 4739 Ridge Rd
- 6209 Archmere Ave
- 6025 Northcliff Ave
- 6904 & 6908 Southfield Ave
- 4488 W 57th St
- 4484 W 57th St
- 4491 W 58th St
- 4487 W 58th St
- 4480 W 57th St
- 4495 W 58th St
- 4483 W 58th St
- 4476 W 57th St
- 4479 W 58th St
- 5709 Gifford Ave
- 5713 Gifford Ave
- 5705 Gifford Ave
- 5717 Gifford Ave
- 4491 W 57th St
- 4472 W 57th St
- 4487 W 57th St
- 4495 W 57th St
- 5701 Gifford Ave
- 5721 Gifford Ave
- 4483 W 57th St