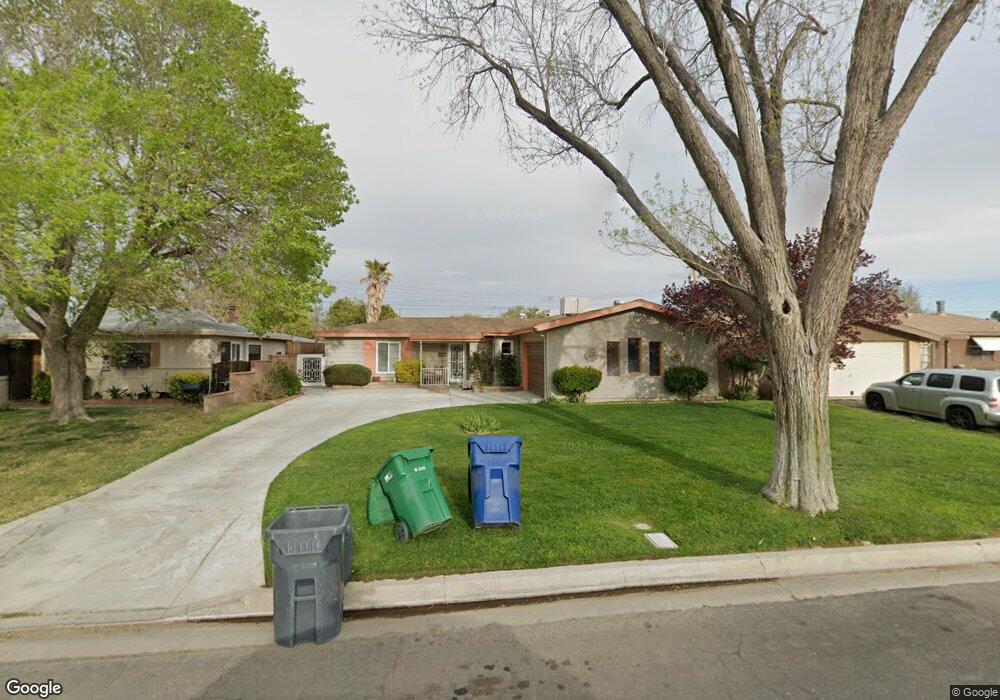
44926 Lorimer Ave Lancaster, CA 93534
Central Lancaster NeighborhoodEstimated Value: $397,223 - $415,000
3
Beds
2
Baths
1,273
Sq Ft
$318/Sq Ft
Est. Value
About This Home
This home is located at 44926 Lorimer Ave, Lancaster, CA 93534 and is currently estimated at $404,556, approximately $317 per square foot. 44926 Lorimer Ave is a home located in Los Angeles County with nearby schools including Monte Vista Elementary School, Amargosa Creek Middle School, and Lancaster High School.
Ownership History
Date
Name
Owned For
Owner Type
Purchase Details
Closed on
Mar 22, 2019
Sold by
Alexander Dale Anne
Bought by
Dale Anne Alexander Revocable Trust
Current Estimated Value
Purchase Details
Closed on
Feb 7, 2002
Sold by
Krause Joseph F
Bought by
Alexander Dale Anne
Home Financials for this Owner
Home Financials are based on the most recent Mortgage that was taken out on this home.
Original Mortgage
$114,207
Outstanding Balance
$46,823
Interest Rate
6.94%
Mortgage Type
FHA
Estimated Equity
$357,733
Purchase Details
Closed on
Apr 19, 2001
Sold by
Huckaby Craig M and Huckaby Jodine
Bought by
Krause Joseph F
Home Financials for this Owner
Home Financials are based on the most recent Mortgage that was taken out on this home.
Original Mortgage
$91,350
Interest Rate
7.06%
Purchase Details
Closed on
Mar 11, 2000
Sold by
Robertson Susan
Bought by
Huckaby Craig M
Create a Home Valuation Report for This Property
The Home Valuation Report is an in-depth analysis detailing your home's value as well as a comparison with similar homes in the area
Home Values in the Area
Average Home Value in this Area
Purchase History
| Date | Buyer | Sale Price | Title Company |
|---|---|---|---|
| Dale Anne Alexander Revocable Trust | -- | None Available | |
| Alexander Dale Anne | $116,000 | First American Title Co | |
| Krause Joseph F | $101,500 | Lawyers Title Company | |
| Huckaby Craig M | -- | Lawyers Title |
Source: Public Records
Mortgage History
| Date | Status | Borrower | Loan Amount |
|---|---|---|---|
| Open | Alexander Dale Anne | $114,207 | |
| Previous Owner | Krause Joseph F | $91,350 |
Source: Public Records
Tax History
| Year | Tax Paid | Tax Assessment Tax Assessment Total Assessment is a certain percentage of the fair market value that is determined by local assessors to be the total taxable value of land and additions on the property. | Land | Improvement |
|---|---|---|---|---|
| 2025 | $3,307 | $171,340 | $34,258 | $137,082 |
| 2024 | $3,307 | $167,982 | $33,587 | $134,395 |
| 2023 | $3,238 | $164,689 | $32,929 | $131,760 |
| 2022 | $3,098 | $161,461 | $32,284 | $129,177 |
| 2021 | $2,663 | $158,296 | $31,651 | $126,645 |
| 2020 | $2,634 | $156,674 | $31,327 | $125,347 |
| 2019 | $2,590 | $153,603 | $30,713 | $122,890 |
| 2018 | $2,544 | $150,592 | $30,111 | $120,481 |
| 2016 | $2,414 | $144,746 | $28,943 | $115,803 |
| 2015 | $2,384 | $142,573 | $28,509 | $114,064 |
| 2014 | $2,377 | $139,781 | $27,951 | $111,830 |
Source: Public Records
Map
Nearby Homes
- 45011 Lorimer Ave
- 1530 W Kildare St
- 44804 Lorimer Ave
- 0 W 15th St Unit 25008497
- 44916 18th St W
- 0 W Lancaster Blvd Unit SW26048281
- 1828 Louise Ave
- 45116 Camolin Ave
- 44761 18th St W
- 45108 18th St W
- 1354 W Jenner St
- 45153 17th St W
- 1346 W Ivyton St
- 0 W Newgrove St
- 1754 W Milling St
- 44632 17th St W
- 45208 17th St W
- 44705 Lowtree Ave
- 45228 Lorimer Ave
- 0 W Avenue I Unit IG25189381
- 44932 Lorimer Ave
- 44920 Lorimer Ave
- 44914 Lorimer Ave
- 44938 Lorimer Ave
- 44927 16th St W
- 44933 16th St W
- 44921 16th St W
- 44939 16th St W
- 44908 Lorimer Ave
- 44944 Lorimer Ave
- 44915 16th St W
- 44929 Lorimer Ave
- 44923 Lorimer Ave
- 44935 Lorimer Ave
- 44945 16th St W
- 44909 16th St W
- 44917 Lorimer Ave
- 44941 Lorimer Ave
- 44950 Lorimer Ave
- 44902 Lorimer Ave
Your Personal Tour Guide
Ask me questions while you tour the home.