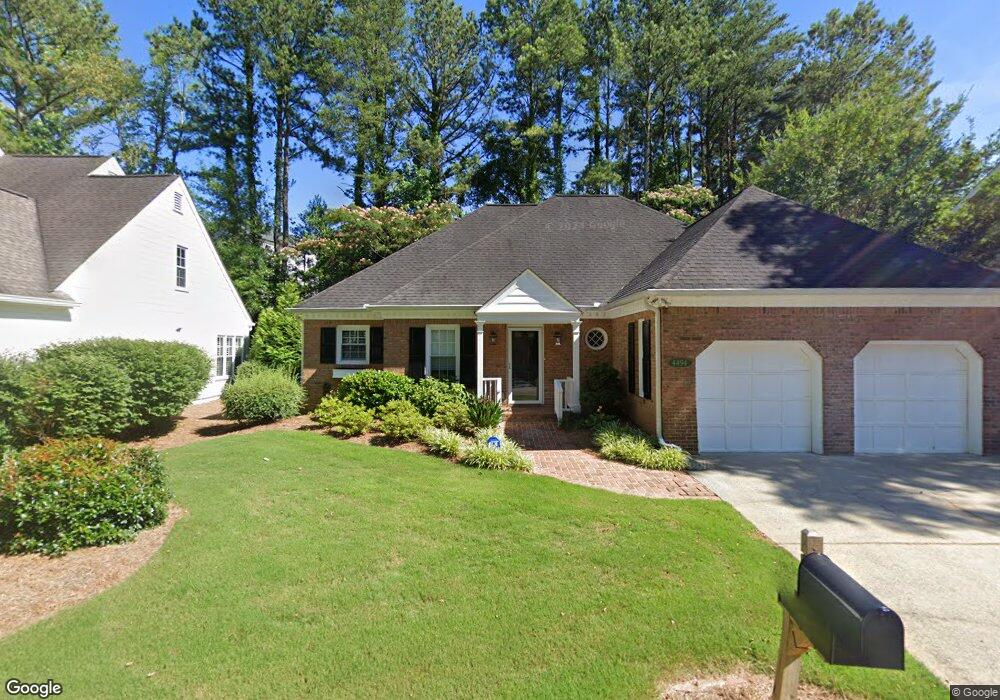
4494 Dobbs Crossing Marietta, GA 30068
Estimated Value: $592,000 - $688,000
2
Beds
3
Baths
1,480
Sq Ft
$441/Sq Ft
Est. Value
About This Home
This home is located at 4494 Dobbs Crossing, Marietta, GA 30068 and is currently estimated at $652,989, approximately $441 per square foot. 4494 Dobbs Crossing is a home located in Cobb County with nearby schools including Mount Bethel Elementary School, Dickerson Middle School, and Walton High School.
Ownership History
Date
Name
Owned For
Owner Type
Purchase Details
Closed on
Dec 4, 2023
Sold by
Buss-Hurst Lara O
Bought by
Kadambi Jaikrishnan Rajgopal and Kadambi Sudha Swamy
Current Estimated Value
Purchase Details
Closed on
Mar 31, 2016
Sold by
Buss Juanita E
Bought by
Buss Juanita E and Buss-Hurst Lara O
Purchase Details
Closed on
Jun 30, 2015
Sold by
Denton Cynthia E
Bought by
Buss Juanita E
Home Financials for this Owner
Home Financials are based on the most recent Mortgage that was taken out on this home.
Original Mortgage
$300,000
Interest Rate
3.92%
Mortgage Type
New Conventional
Purchase Details
Closed on
Dec 15, 2008
Sold by
Gordon Amelia B
Bought by
Denton Cynhtia E
Home Financials for this Owner
Home Financials are based on the most recent Mortgage that was taken out on this home.
Original Mortgage
$292,045
Interest Rate
6.1%
Mortgage Type
Stand Alone Second
Create a Home Valuation Report for This Property
The Home Valuation Report is an in-depth analysis detailing your home's value as well as a comparison with similar homes in the area
Home Values in the Area
Average Home Value in this Area
Purchase History
| Date | Buyer | Sale Price | Title Company |
|---|---|---|---|
| Kadambi Jaikrishnan Rajgopal | $625,000 | None Listed On Document | |
| Buss Juanita E | -- | -- | |
| Buss Juanita E | $342,000 | -- | |
| Denton Cynhtia E | $295,900 | -- |
Source: Public Records
Mortgage History
| Date | Status | Borrower | Loan Amount |
|---|---|---|---|
| Previous Owner | Buss Juanita E | $300,000 | |
| Previous Owner | Denton Cynhtia E | $292,045 |
Source: Public Records
Tax History Compared to Growth
Tax History
| Year | Tax Paid | Tax Assessment Tax Assessment Total Assessment is a certain percentage of the fair market value that is determined by local assessors to be the total taxable value of land and additions on the property. | Land | Improvement |
|---|---|---|---|---|
| 2024 | $6,077 | $201,560 | $60,000 | $141,560 |
| 2023 | $4,682 | $155,276 | $50,000 | $105,276 |
| 2022 | $4,338 | $142,948 | $37,600 | $105,348 |
| 2021 | $4,338 | $142,948 | $37,600 | $105,348 |
| 2020 | $4,338 | $142,948 | $37,600 | $105,348 |
| 2019 | $3,785 | $124,720 | $37,600 | $87,120 |
| 2018 | $3,785 | $124,720 | $37,600 | $87,120 |
| 2017 | $3,392 | $117,972 | $37,600 | $80,372 |
| 2016 | $952 | $117,972 | $37,600 | $80,372 |
| 2015 | $2,537 | $96,368 | $37,600 | $58,768 |
| 2014 | $2,557 | $96,368 | $0 | $0 |
Source: Public Records
Map
Nearby Homes
- 4503 Dobbs Crossing
- 1097 Princeton Walk NE Unit 1A
- 4528 Lashley Ct NE
- 4420 Nassau Way NE
- 857 Chestnut Lake Dr NE Unit 3
- 861 Chestnut Lake Dr NE
- 1448 Heritage Glen Dr
- 4030 Addie Ln Unit 5
- 748 Olde Towne Ln
- 742 Olde Towne Ln
- 4831 Emmitt Point NE
- 807 Snider Walk NE
- 775 Hadley Ln NE
- 1279 Colony Place
- 1038 Seven Springs Cir
- 4096 Audubon Dr Unit 4096
- 633 Cagle Rd
- 4494 Dobbs Crossing
- 4492 Dobbs Crossing
- 4496 Dobbs Crossing
- 4498 Dobbs Crossing
- 4490 Dobbs Crossing
- 4497 Dobbs Crossing
- 4495 Dobbs Crossing
- 4499 Dobbs Crossing
- 0 Dobbs Crossing Unit 7437857
- 0 Dobbs Crossing Unit 7128091
- 0 Dobbs Crossing Unit 7082303
- 0 Dobbs Crossing Unit 3267493
- 0 Dobbs Crossing Unit 3192677
- 0 Dobbs Crossing Unit 8856827
- 0 Dobbs Crossing Unit 8796838
- 0 Dobbs Crossing Unit 8617102
- 0 Dobbs Crossing Unit 8598302
- 0 Dobbs Crossing Unit 8480692
- 0 Dobbs Crossing Unit 8420432
- 0 Dobbs Crossing Unit 8414519