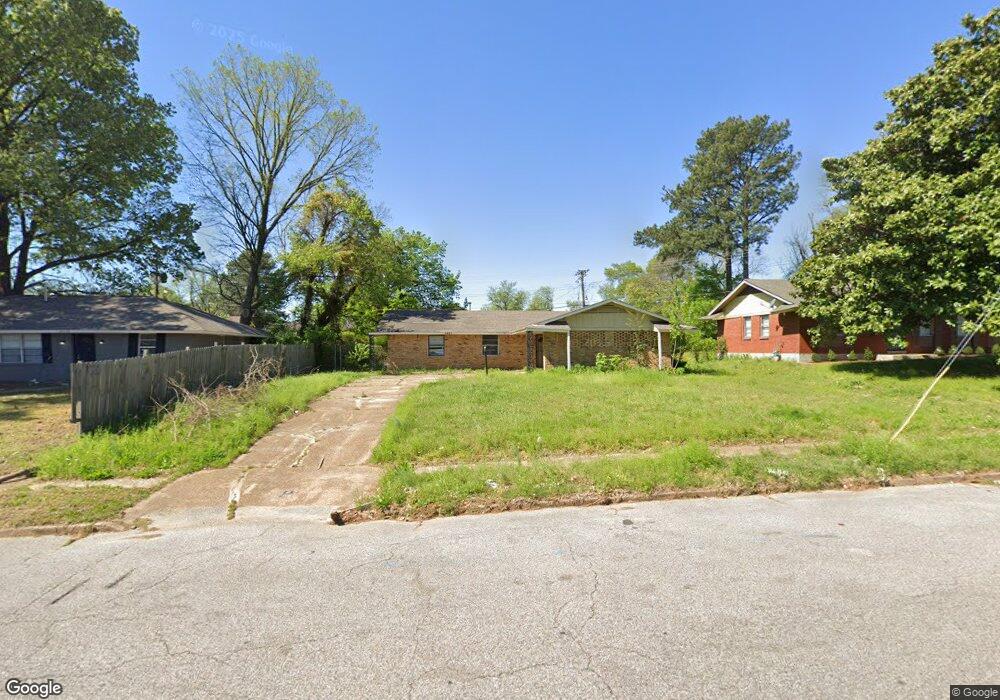
4497 Westmont Rd Memphis, TN 38109
Westwood NeighborhoodEstimated Value: $120,000 - $135,000
3
Beds
2
Baths
1,593
Sq Ft
$81/Sq Ft
Est. Value
About This Home
This home is located at 4497 Westmont Rd, Memphis, TN 38109 and is currently estimated at $128,327, approximately $80 per square foot. 4497 Westmont Rd is a home located in Shelby County with nearby schools including Levi Elementary School, Chickasaw Middle School, and Westwood High School.
Ownership History
Date
Name
Owned For
Owner Type
Purchase Details
Closed on
Feb 5, 2018
Sold by
Gp Memphis Cashfflow
Bought by
Momtaheni Alyssa
Current Estimated Value
Purchase Details
Closed on
Sep 1, 2017
Sold by
Worsham Don
Bought by
Gp Memphis Cashflow
Purchase Details
Closed on
Jan 25, 2011
Sold by
First Premier Properties Llc
Bought by
Worsham Donald L
Home Financials for this Owner
Home Financials are based on the most recent Mortgage that was taken out on this home.
Original Mortgage
$42,700
Interest Rate
4.79%
Mortgage Type
Seller Take Back
Purchase Details
Closed on
Aug 12, 2010
Sold by
Fannie Mae
Bought by
First Premier Properties Llc
Purchase Details
Closed on
Jun 2, 2010
Sold by
Jones Jeremy D
Bought by
Federal National Mortgage Association
Purchase Details
Closed on
Jul 7, 2004
Sold by
Smith Clint and Smith Barbara A
Bought by
American General Finance Inc
Create a Home Valuation Report for This Property
The Home Valuation Report is an in-depth analysis detailing your home's value as well as a comparison with similar homes in the area
Home Values in the Area
Average Home Value in this Area
Purchase History
| Date | Buyer | Sale Price | Title Company |
|---|---|---|---|
| Momtaheni Alyssa | $71,900 | Saddle Creek Title Llc | |
| Gp Memphis Cashflow | $260,901 | Saddle Creek Title Llc | |
| Worsham Donald L | $42,700 | Baymark Title & Escrow Servi | |
| First Premier Properties Llc | $22,000 | Preferred Title & Escrow Llc | |
| Federal National Mortgage Association | $65,595 | None Available | |
| American General Finance Inc | $45,000 | -- |
Source: Public Records
Mortgage History
| Date | Status | Borrower | Loan Amount |
|---|---|---|---|
| Previous Owner | Worsham Donald L | $42,700 |
Source: Public Records
Tax History Compared to Growth
Tax History
| Year | Tax Paid | Tax Assessment Tax Assessment Total Assessment is a certain percentage of the fair market value that is determined by local assessors to be the total taxable value of land and additions on the property. | Land | Improvement |
|---|---|---|---|---|
| 2025 | $741 | $31,125 | $2,525 | $28,600 |
| 2024 | $741 | $21,850 | $2,250 | $19,600 |
| 2023 | $1,331 | $21,850 | $2,250 | $19,600 |
| 2022 | $1,331 | $21,850 | $2,250 | $19,600 |
| 2021 | $1,347 | $21,850 | $2,250 | $19,600 |
| 2020 | $1,228 | $16,950 | $2,250 | $14,700 |
| 2019 | $1,228 | $16,950 | $2,250 | $14,700 |
| 2018 | $1,228 | $16,950 | $2,250 | $14,700 |
| 2017 | $697 | $16,950 | $2,250 | $14,700 |
| 2016 | $713 | $16,325 | $0 | $0 |
| 2014 | $713 | $16,325 | $0 | $0 |
Source: Public Records
Map
Nearby Homes
- 806 Parkrose Rd
- 668 Westview Rd
- 4539 Weaver Rd SW
- 693 Bonwood Ave
- 4340 Bluebell St
- 4344 Bow St
- 4487 Weaver Rd S
- 436 Western Park Dr
- 803 Ledbetter Ave
- 906 Western Park Dr
- 4269 Tomahawk St
- 4501 S 3rd St
- 4087 Weaver Rd
- 646 Western Park Dr
- 4334 Melwood St
- 4374 Ford Rd
- 4233 Glenbrook Dr
- 4733 12th Rd
- 4335 Ford Rd
- 648 Pawnee Ave
- 4501 Westmont Rd
- 4518 Marigold Ln
- 4507 Westmont Rd
- 4524 Marigold Ln
- 4514 Marigold Ln
- 4487 Westmont Rd
- 849 Bramblewood Ln
- 4528 Marigold Ln
- 4513 Westmont Rd
- 857 Bramblewood Ln
- 4536 Marigold Ln
- 4519 Westmont Rd
- 848 Hackberry Ln
- 4513 Marigold Ln
- 4471 Westmont Rd
- 847 Hackberry Ln
- 812 Parkrose Rd
- 850 Bramblewood Ln
- 869 Bramblewood Ln
- 858 Bramblewood Ln