Estimated Value: $541,523 - $637,000
2
Beds
2
Baths
2,356
Sq Ft
$256/Sq Ft
Est. Value
About This Home
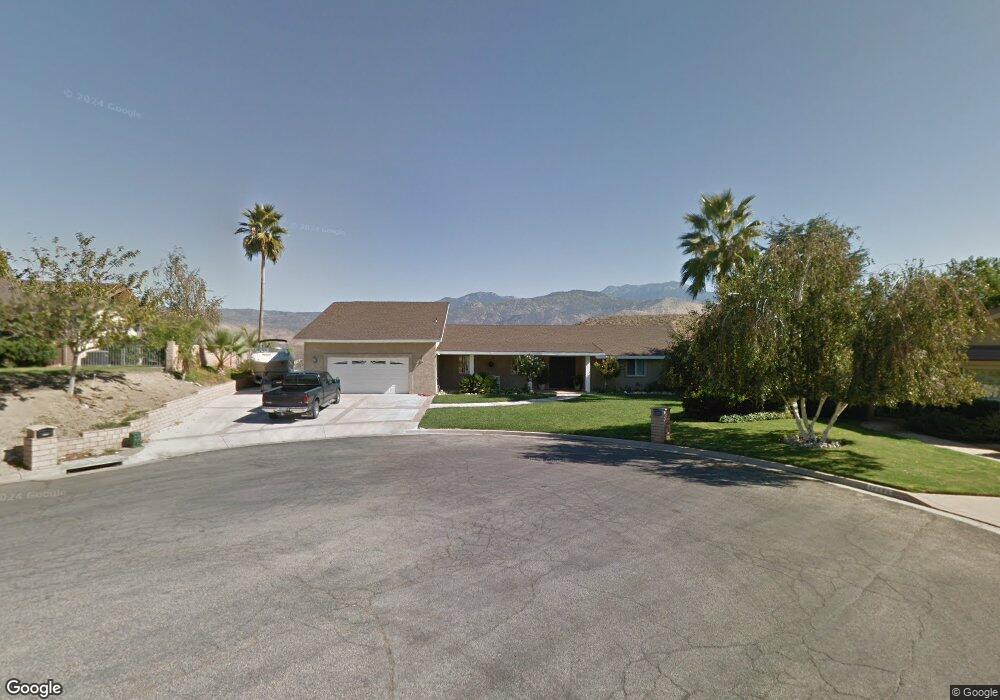
This home is located at 44980 Viejo Dr, Hemet, CA 92544 and is currently estimated at $603,631, approximately $256 per square foot. 44980 Viejo Dr is a home located in Riverside County with nearby schools including Valle Vista Elementary School, Dartmouth Middle School, and Hemet High School.
Ownership History
Date
Name
Owned For
Owner Type
Purchase Details
Closed on
Apr 7, 2011
Sold by
Brennan Terrance T
Bought by
Brennan Terrance T and Brennan Delynda E
Current Estimated Value
Home Financials for this Owner
Home Financials are based on the most recent Mortgage that was taken out on this home.
Original Mortgage
$154,000
Outstanding Balance
$106,395
Interest Rate
4.83%
Mortgage Type
New Conventional
Estimated Equity
$497,236
Purchase Details
Closed on
Mar 29, 2011
Sold by
Department Of Veterans Affairs
Bought by
Brennan Terrance T
Home Financials for this Owner
Home Financials are based on the most recent Mortgage that was taken out on this home.
Original Mortgage
$154,000
Outstanding Balance
$106,395
Interest Rate
4.83%
Mortgage Type
New Conventional
Estimated Equity
$497,236
Purchase Details
Closed on
Apr 4, 2000
Sold by
Evans Bob Ella
Bought by
Va
Create a Home Valuation Report for This Property
The Home Valuation Report is an in-depth analysis detailing your home's value as well as a comparison with similar homes in the area
Home Values in the Area
Average Home Value in this Area
Purchase History
| Date | Buyer | Sale Price | Title Company |
|---|---|---|---|
| Brennan Terrance T | -- | Lawyers Title | |
| Brennan Terrance T | -- | Lawyers Title | |
| Va | $191,000 | Orange Coast Title |
Source: Public Records
Mortgage History
| Date | Status | Borrower | Loan Amount |
|---|---|---|---|
| Open | Brennan Terrance T | $154,000 |
Source: Public Records
Tax History Compared to Growth
Tax History
| Year | Tax Paid | Tax Assessment Tax Assessment Total Assessment is a certain percentage of the fair market value that is determined by local assessors to be the total taxable value of land and additions on the property. | Land | Improvement |
|---|---|---|---|---|
| 2025 | $3,300 | $294,649 | $83,264 | $211,385 |
| 2023 | $3,300 | $283,210 | $80,032 | $203,178 |
| 2022 | $3,193 | $277,658 | $78,463 | $199,195 |
| 2021 | $3,140 | $272,215 | $76,925 | $195,290 |
| 2020 | $3,102 | $269,425 | $76,137 | $193,288 |
| 2019 | $3,034 | $264,144 | $74,645 | $189,499 |
| 2018 | $2,939 | $258,966 | $73,183 | $185,783 |
| 2017 | $2,904 | $253,890 | $71,749 | $182,141 |
| 2016 | $2,883 | $248,913 | $70,343 | $178,570 |
| 2015 | $2,874 | $245,177 | $69,288 | $175,889 |
| 2014 | $2,743 | $240,377 | $67,932 | $172,445 |
Source: Public Records
Map
Nearby Homes
- 44940 Viejo Dr
- 0 Grant Ave
- 26320 Rim Rd
- 26227 Grant Ave
- 26617 Garrett Ryan Ct
- 26565 Valle Heights Rd
- 44273 French Cir
- 45055 California 74 Unit 54
- 44725 E Florida Ave Unit 70
- 44725 E Florida Ave Unit 132
- 44725 E Florida Ave Unit 62
- 44725 E Florida Ave Unit 212
- 44725 E Florida Ave Unit 40
- 45270 Cash St
- 44725 State Highway 74 Unit 115
- 44725 State Highway 74 Unit 103
- 44725 State Highway 74 Unit 108
- 44725 State Highway 74 Unit 4
- 44725 State Highway 74 Unit 43
- 44725 State Highway 74 Unit 177