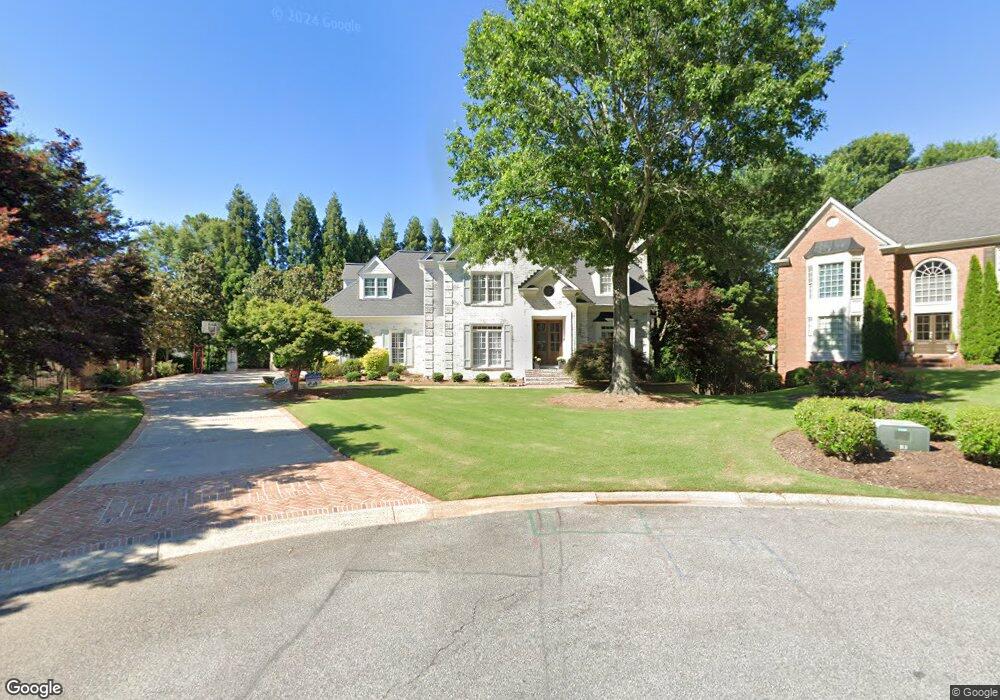
4499 Chestnut Lake Ct NE Unit 3 Marietta, GA 30068
Estimated Value: $936,000 - $1,132,568
4
Beds
5
Baths
3,243
Sq Ft
$326/Sq Ft
Est. Value
About This Home
This home is located at 4499 Chestnut Lake Ct NE Unit 3, Marietta, GA 30068 and is currently estimated at $1,055,642, approximately $325 per square foot. 4499 Chestnut Lake Ct NE Unit 3 is a home located in Cobb County with nearby schools including Mount Bethel Elementary School, Dickerson Middle School, and Walton High School.
Ownership History
Date
Name
Owned For
Owner Type
Purchase Details
Closed on
Apr 22, 2022
Sold by
Steven Dunman
Bought by
Cawthon William Franklin and Cawthon Meredith Graham
Current Estimated Value
Purchase Details
Closed on
Jul 25, 2017
Sold by
Poling Debra H
Bought by
Dunman Steven and Dunman Amy
Home Financials for this Owner
Home Financials are based on the most recent Mortgage that was taken out on this home.
Original Mortgage
$532,000
Interest Rate
3.88%
Mortgage Type
New Conventional
Purchase Details
Closed on
Jun 13, 2013
Sold by
Poling Kurt M
Bought by
Poling Debra H
Home Financials for this Owner
Home Financials are based on the most recent Mortgage that was taken out on this home.
Original Mortgage
$305,250
Interest Rate
3.59%
Mortgage Type
New Conventional
Purchase Details
Closed on
May 29, 2001
Sold by
Fletcher Curtiss D and Fletcher Roberta R
Bought by
Poling Kurt M and Poling Debra H
Home Financials for this Owner
Home Financials are based on the most recent Mortgage that was taken out on this home.
Original Mortgage
$329,600
Interest Rate
6.5%
Mortgage Type
New Conventional
Create a Home Valuation Report for This Property
The Home Valuation Report is an in-depth analysis detailing your home's value as well as a comparison with similar homes in the area
Home Values in the Area
Average Home Value in this Area
Purchase History
| Date | Buyer | Sale Price | Title Company |
|---|---|---|---|
| Cawthon William Franklin | $850,000 | None Listed On Document | |
| Dunman Steven | $665,000 | -- | |
| Poling Debra H | $305,250 | -- | |
| Poling Kurt M | $412,000 | -- |
Source: Public Records
Mortgage History
| Date | Status | Borrower | Loan Amount |
|---|---|---|---|
| Previous Owner | Dunman Steven | $532,000 | |
| Previous Owner | Poling Debra H | $305,250 | |
| Previous Owner | Poling Kurt M | $329,600 |
Source: Public Records
Tax History Compared to Growth
Tax History
| Year | Tax Paid | Tax Assessment Tax Assessment Total Assessment is a certain percentage of the fair market value that is determined by local assessors to be the total taxable value of land and additions on the property. | Land | Improvement |
|---|---|---|---|---|
| 2024 | $9,982 | $331,064 | $64,000 | $267,064 |
| 2023 | $9,982 | $331,064 | $64,000 | $267,064 |
| 2022 | $7,261 | $248,272 | $64,000 | $184,272 |
| 2021 | $7,261 | $248,272 | $64,000 | $184,272 |
| 2020 | $7,596 | $250,292 | $54,000 | $196,292 |
| 2019 | $7,596 | $250,292 | $54,000 | $196,292 |
| 2018 | $7,596 | $250,292 | $54,000 | $196,292 |
| 2017 | $6,086 | $250,292 | $54,000 | $196,292 |
| 2016 | $5,577 | $226,660 | $54,000 | $172,660 |
| 2015 | $5,686 | $226,660 | $54,000 | $172,660 |
| 2014 | $6,147 | $206,912 | $0 | $0 |
Source: Public Records
Map
Nearby Homes
- 861 Chestnut Lake Dr NE
- 4528 Lashley Ct NE
- 786 Fairfield Dr
- 633 Cagle Rd
- 1097 Princeton Walk NE Unit 1A
- 4503 Dobbs Crossing
- 4250 Summit Dr
- 4232 Edgewood Ct
- 4596 Oakside Point
- 807 Snider Walk NE
- 4002 Edgewood Ct Unit 9
- 4420 Nassau Way NE
- 4831 Emmitt Point NE
- 775 Hadley Ln NE
- 4096 Audubon Dr Unit 4096
- 4201 Fairgreen Terrace NE
- 748 Olde Towne Ln
- 742 Olde Towne Ln
- 4500 Chestnut Lake Ct NE Unit 3
- 848 Chestnut Lake Dr NE
- 4424 Dunmore Rd NE Unit 4
- 4420 Dunmore Rd NE Unit 4
- 850 Chestnut Lake Dr NE
- 4426 Dunmore Rd NE
- 846 Chestnut Lake Dr NE
- 4428 Dunmore Rd NE Unit 4
- 4430 Dunmore Rd NE
- 4418 Dunmore Rd NE Unit 4
- 844 Chestnut Lake Dr NE Unit 3
- 852 Chestnut Lake Dr NE
- 4432 Dunmore Rd NE
- 4419 Dunmore Rd NE Unit 4
- 4419 Dunmore Rd NE
- 4421 Dunmore Rd NE Unit 4
- 845 Chestnut Lake Dr NE
- 845 Chestnut Lake Dr NE Unit 7
- 4434 Dunmore Rd NE Unit 4
- 847 Chestnut Lake Dr NE