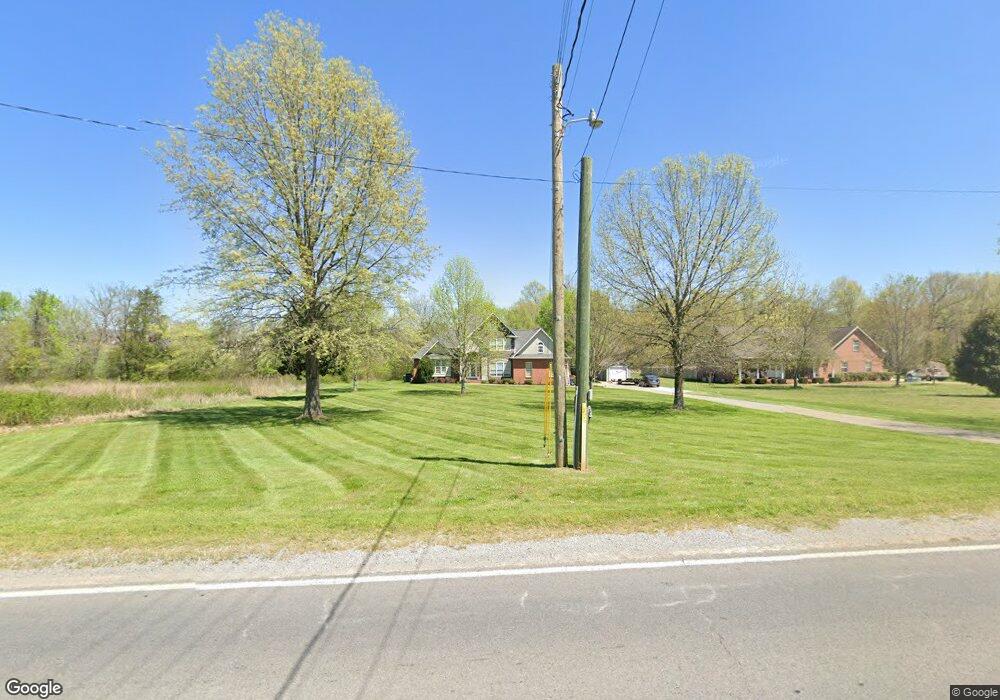
4499 Coles Ferry Pike Lebanon, TN 37087
Estimated Value: $446,296 - $560,000
--
Bed
3
Baths
3,714
Sq Ft
$139/Sq Ft
Est. Value
About This Home
This home is located at 4499 Coles Ferry Pike, Lebanon, TN 37087 and is currently estimated at $515,324, approximately $138 per square foot. 4499 Coles Ferry Pike is a home located in Wilson County with nearby schools including Carroll Oakland Elementary School, Lebanon High School, and Friendship Christian School.
Ownership History
Date
Name
Owned For
Owner Type
Purchase Details
Closed on
May 27, 2005
Sold by
Denney Raymond Y
Bought by
Mcdonough Michael J
Current Estimated Value
Home Financials for this Owner
Home Financials are based on the most recent Mortgage that was taken out on this home.
Original Mortgage
$212,000
Outstanding Balance
$110,534
Interest Rate
5.74%
Estimated Equity
$404,790
Purchase Details
Closed on
May 20, 2005
Sold by
Denney Raymond Y
Bought by
Mcdonough Michael J
Home Financials for this Owner
Home Financials are based on the most recent Mortgage that was taken out on this home.
Original Mortgage
$212,000
Outstanding Balance
$110,534
Interest Rate
5.74%
Estimated Equity
$404,790
Purchase Details
Closed on
Dec 3, 2001
Sold by
Majestic Construction Co
Bought by
Denney Raymond Y
Purchase Details
Closed on
Jul 15, 1999
Bought by
Majestic Const Co
Create a Home Valuation Report for This Property
The Home Valuation Report is an in-depth analysis detailing your home's value as well as a comparison with similar homes in the area
Home Values in the Area
Average Home Value in this Area
Purchase History
| Date | Buyer | Sale Price | Title Company |
|---|---|---|---|
| Mcdonough Michael J | $265,000 | -- | |
| Mcdonough Michael J | $265,000 | -- | |
| Denney Raymond Y | $230,000 | -- | |
| Majestic Const Co | $37,500 | -- |
Source: Public Records
Mortgage History
| Date | Status | Borrower | Loan Amount |
|---|---|---|---|
| Open | Majestic Const Co | $212,000 | |
| Closed | Majestic Const Co | $53,000 | |
| Closed | Majestic Const Co | $212,000 | |
| Closed | Majestic Const Co | $53,000 |
Source: Public Records
Tax History Compared to Growth
Tax History
| Year | Tax Paid | Tax Assessment Tax Assessment Total Assessment is a certain percentage of the fair market value that is determined by local assessors to be the total taxable value of land and additions on the property. | Land | Improvement |
|---|---|---|---|---|
| 2024 | $1,445 | $75,675 | $13,750 | $61,925 |
| 2022 | $1,445 | $75,675 | $13,750 | $61,925 |
| 2021 | $1,435 | $75,675 | $13,750 | $61,925 |
| 2020 | $1,569 | $75,175 | $13,750 | $61,425 |
| 2019 | $1,569 | $62,275 | $12,175 | $50,100 |
| 2018 | $1,569 | $62,275 | $12,175 | $50,100 |
| 2017 | $1,569 | $62,275 | $12,175 | $50,100 |
| 2016 | $1,569 | $62,275 | $12,175 | $50,100 |
| 2015 | $1,601 | $62,275 | $12,175 | $50,100 |
| 2014 | $1,486 | $57,827 | $0 | $0 |
Source: Public Records
Map
Nearby Homes
- 615 Greene Dr
- 128 Mann Rd
- 160 Mann Rd
- 0 Coles Ferry Pike Unit RTC3001704
- 0 Trice Rd
- 811 Brook Trail
- 601 Doe Ridge Ct
- 906 Koble Dr
- 849 Brook Trail
- 1009 Stone Creek Ln
- 1102 Collin Dr #206
- 848 Brook Trail
- 0 Berea Church Rd
- 854 Brook Trail
- 1003 Stone Creek Ln #221
- 758 Holt Rd
- 1103 Collin Dr
- 1107 Collin Dr
- 1108 Collin Dr #209
- 129 Springfield Dr
- 4463 Coles Ferry Pike
- 4545 Coles Ferry Pike
- 4439 Coles Ferry Pike
- 638 Greene Dr
- 636 Greene Dr
- 0 Cedarway Dr
- 40 Cedar Grove Rd
- 4 Cedar Grove Rd
- 0 Cedar Grove Rd
- 640 Greene Dr
- 4396 Coles Ferry Pike
- 4522 Coles Ferry Pike
- 25 Cedar Grove Rd
- 4599 Coles Ferry Pike
- 1 Cedar Grove Rd
- 4464 Coles Ferry Pike
- 31 Cedar Grove Rd
- 805 Kimber Ln
- 4615 Coles Ferry Pike
- 807 Kimber Ln