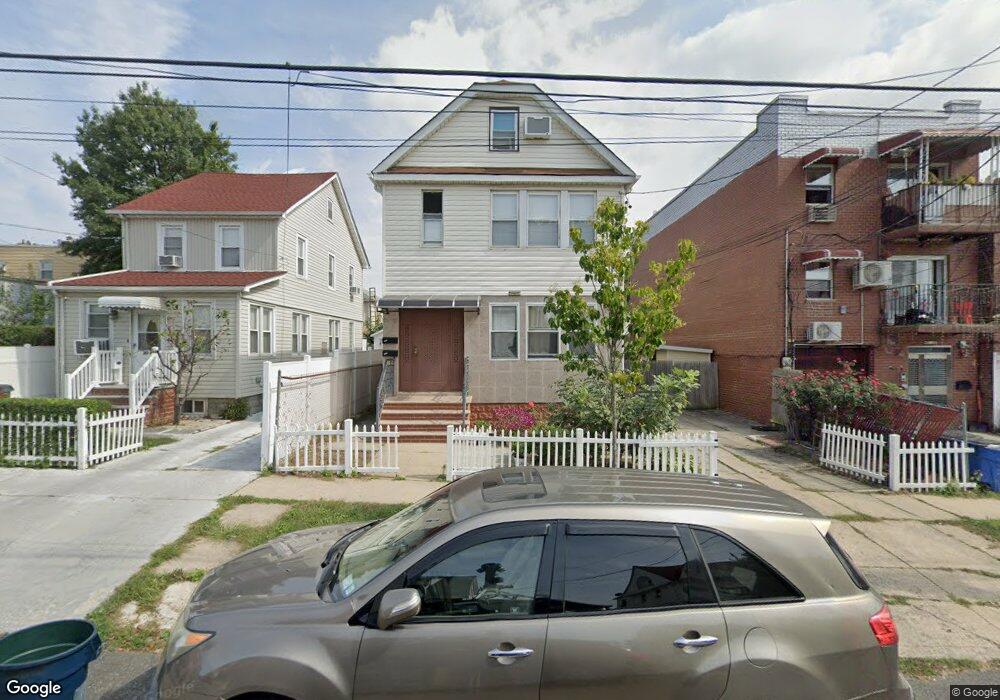
45-15 163rd St Unit 1FL Flushing, NY 11358
East Flushing NeighborhoodEstimated Value: $1,270,672 - $1,793,000
4
Beds
2
Baths
2,000
Sq Ft
$734/Sq Ft
Est. Value
About This Home
This home is located at 45-15 163rd St Unit 1FL, Flushing, NY 11358 and is currently estimated at $1,467,168, approximately $733 per square foot. 45-15 163rd St Unit 1FL is a home located in Queens County with nearby schools including P.S. 107 Thomas A Dooley, I.S. 25 Adrien Block, and Francis Lewis High School.
Ownership History
Date
Name
Owned For
Owner Type
Purchase Details
Closed on
Aug 28, 2017
Sold by
Chen Li Ping and Lu Weimin
Bought by
Zheng Hui Mei
Current Estimated Value
Home Financials for this Owner
Home Financials are based on the most recent Mortgage that was taken out on this home.
Original Mortgage
$450,000
Outstanding Balance
$374,591
Interest Rate
3.96%
Mortgage Type
New Conventional
Estimated Equity
$1,092,577
Purchase Details
Closed on
Jun 25, 2013
Sold by
Bautista Jose M and Bautista Willie M
Bought by
Chen Li Ping and Lu Weimin
Home Financials for this Owner
Home Financials are based on the most recent Mortgage that was taken out on this home.
Original Mortgage
$480,000
Interest Rate
3.92%
Mortgage Type
New Conventional
Purchase Details
Closed on
Jan 11, 2000
Sold by
Bautista Pacifico S and Bautista Angelina M
Bought by
Bautista Jose M and Bautista Willie M
Create a Home Valuation Report for This Property
The Home Valuation Report is an in-depth analysis detailing your home's value as well as a comparison with similar homes in the area
Home Values in the Area
Average Home Value in this Area
Purchase History
| Date | Buyer | Sale Price | Title Company |
|---|---|---|---|
| Zheng Hui Mei | $1,188,000 | -- | |
| Zheng Hui Mei | $1,188,000 | -- | |
| Zheng Hui Mei | $1,188,000 | -- | |
| Chen Li Ping | $800,000 | -- | |
| Chen Li Ping | $800,000 | -- | |
| Bautista Jose M | -- | -- | |
| Bautista Jose M | -- | -- |
Source: Public Records
Mortgage History
| Date | Status | Borrower | Loan Amount |
|---|---|---|---|
| Open | Zheng Hui Mei | $450,000 | |
| Closed | Zheng Hui Mei | $450,000 | |
| Previous Owner | Chen Li Ping | $480,000 |
Source: Public Records
Tax History
| Year | Tax Paid | Tax Assessment Tax Assessment Total Assessment is a certain percentage of the fair market value that is determined by local assessors to be the total taxable value of land and additions on the property. | Land | Improvement |
|---|---|---|---|---|
| 2025 | $8,772 | $46,295 | $11,700 | $34,595 |
| 2024 | $8,772 | $43,675 | $13,229 | $30,446 |
| 2023 | $8,276 | $41,206 | $10,637 | $30,569 |
| 2022 | $8,154 | $75,120 | $19,500 | $55,620 |
| 2021 | $8,596 | $71,160 | $19,500 | $51,660 |
| 2020 | $8,166 | $68,880 | $19,500 | $49,380 |
| 2019 | $7,614 | $65,040 | $19,500 | $45,540 |
| 2018 | $7,000 | $34,338 | $10,984 | $23,354 |
| 2017 | $6,939 | $34,038 | $12,500 | $21,538 |
| 2016 | $6,805 | $34,038 | $12,500 | $21,538 |
| 2015 | $3,873 | $32,149 | $14,507 | $17,642 |
| 2014 | $3,873 | $30,330 | $15,207 | $15,123 |
Source: Public Records
Map
Nearby Homes
- 163-02 45th Ave
- 43-58 163rd St
- 45-74 164th St
- 45-18 166th St
- 43-33 163rd St
- 43-24 164th St
- 43-27 162nd St
- 4363 160th St
- 45-57 160th St
- 4344 161st St
- 43-07 162nd St
- 46-12 161st St Unit 1D
- 46-12 161st St Unit 2C
- 4618 161st St Unit C4
- 46-18 161st St Unit C4
- 45-25 168th St
- 4328 168th St
- 42-16 162nd St
- 46-05 158th St
- 167-22 Northern Blvd
- 45-15 163rd St
- 4515 163rd St
- 4515 163rd St Unit 1Fl
- 45-19 163rd St
- 4519 163rd St
- 4513 163rd St
- 4521 163rd St
- 4523 163rd St
- 45-13 163 St
- 45-13 163rd St
- 4525 163rd St
- 45-25 163rd St Unit 2
- 4525 163rd St
- 45-25 163rd St
- 4518 164th St Unit 2FL
- 4518 164th St Unit 1FL
- 4518 164th St
- 4514 164th St
- 4522 164th St
- 4527 163rd St
Your Personal Tour Guide
Ask me questions while you tour the home.