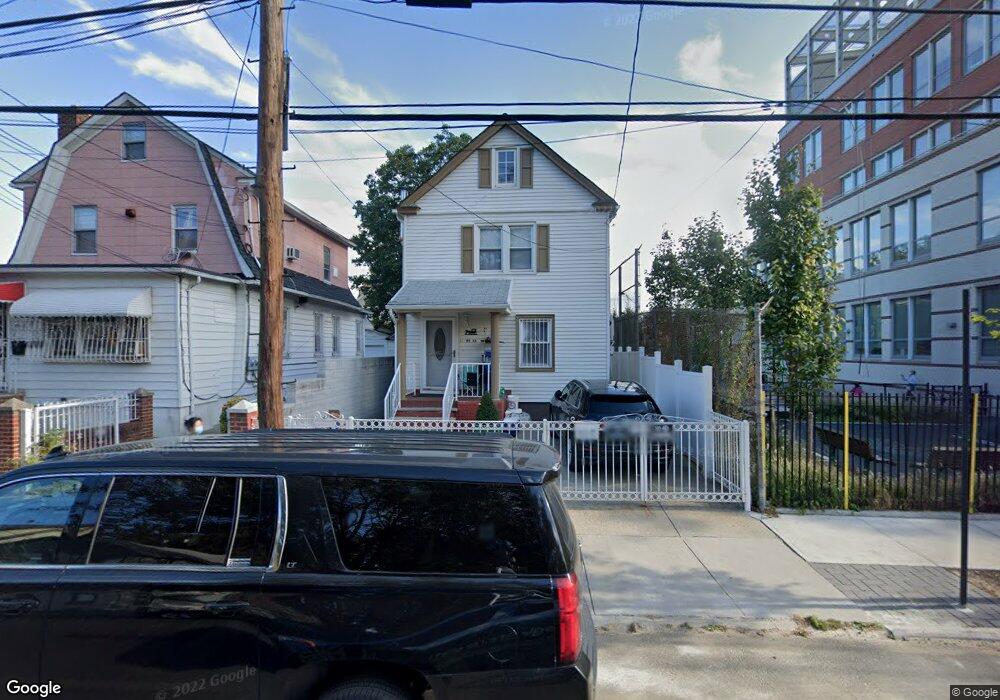
45-35 Union St Flushing, NY 11355
East Flushing NeighborhoodEstimated Value: $1,006,741 - $1,238,000
3
Beds
2
Baths
1,370
Sq Ft
$826/Sq Ft
Est. Value
About This Home
This home is located at 45-35 Union St, Flushing, NY 11355 and is currently estimated at $1,131,185, approximately $825 per square foot. 45-35 Union St is a home located in Queens County with nearby schools including P.S. 024 Andrew Jackson School, Rachel Carson I.S. 237Q, and Francis Lewis High School.
Ownership History
Date
Name
Owned For
Owner Type
Purchase Details
Closed on
May 23, 2016
Sold by
Chen Li Hong and The Estate Of Michelle Jie Chen
Bought by
Li Cheng Huang and Li Yanyun
Current Estimated Value
Home Financials for this Owner
Home Financials are based on the most recent Mortgage that was taken out on this home.
Original Mortgage
$425,000
Outstanding Balance
$337,415
Interest Rate
3.66%
Mortgage Type
New Conventional
Estimated Equity
$793,770
Purchase Details
Closed on
Oct 31, 2013
Sold by
Torres Diana
Bought by
Chen Li Hong and Chen Michelle Jie
Home Financials for this Owner
Home Financials are based on the most recent Mortgage that was taken out on this home.
Original Mortgage
$429,000
Interest Rate
4.24%
Mortgage Type
New Conventional
Purchase Details
Closed on
Apr 11, 2005
Sold by
Torres Bernardo
Bought by
Torres Diana
Purchase Details
Closed on
Nov 22, 1996
Sold by
Greenpoint Bank
Bought by
Torres Bernardo
Home Financials for this Owner
Home Financials are based on the most recent Mortgage that was taken out on this home.
Original Mortgage
$108,800
Interest Rate
7.36%
Create a Home Valuation Report for This Property
The Home Valuation Report is an in-depth analysis detailing your home's value as well as a comparison with similar homes in the area
Home Values in the Area
Average Home Value in this Area
Purchase History
| Date | Buyer | Sale Price | Title Company |
|---|---|---|---|
| Li Cheng Huang | $850,000 | -- | |
| Li Cheng Huang | $850,000 | -- | |
| Li Cheng Huang | $850,000 | -- | |
| Chen Li Hong | $660,000 | -- | |
| Chen Li Hong | $660,000 | -- | |
| Torres Diana | -- | -- | |
| Torres Diana | -- | -- | |
| Torres Bernardo | $136,000 | Ticor Title Guarantee Compan | |
| Torres Bernardo | $136,000 | Ticor Title Guarantee Compan |
Source: Public Records
Mortgage History
| Date | Status | Borrower | Loan Amount |
|---|---|---|---|
| Open | Li Cheng Huang | $425,000 | |
| Closed | Li Cheng Huang | $425,000 | |
| Previous Owner | Chen Li Hong | $429,000 | |
| Previous Owner | Torres Bernardo | $108,800 |
Source: Public Records
Tax History
| Year | Tax Paid | Tax Assessment Tax Assessment Total Assessment is a certain percentage of the fair market value that is determined by local assessors to be the total taxable value of land and additions on the property. | Land | Improvement |
|---|---|---|---|---|
| 2025 | $6,304 | $33,212 | $8,822 | $24,390 |
| 2024 | $6,304 | $31,385 | $8,657 | $22,728 |
| 2023 | $5,958 | $29,665 | $7,864 | $21,801 |
| 2022 | $5,664 | $57,900 | $15,540 | $42,360 |
| 2021 | $5,971 | $57,600 | $15,540 | $42,060 |
| 2020 | $5,858 | $51,240 | $15,540 | $35,700 |
| 2019 | $5,471 | $51,120 | $15,540 | $35,580 |
| 2018 | $5,039 | $24,721 | $9,911 | $14,810 |
| 2017 | $4,820 | $23,644 | $8,377 | $15,267 |
| 2016 | $4,727 | $23,644 | $8,377 | $15,267 |
| 2015 | $2,471 | $23,064 | $9,571 | $13,493 |
| 2014 | $2,471 | $21,795 | $8,941 | $12,854 |
Source: Public Records
Map
Nearby Homes
- 44-69 Kissena Blvd Unit 4M
- 142-03 45th Ave
- 14015 Holly Ave Unit 4th FL
- 44-59 Kissena Blvd Unit 4J
- 4459 Kissena Blvd Unit 2J
- 43-40 Union St Unit 2 D
- 45-30 Smart St
- 137-77 45th Ave Unit 3P
- 4334 Union St Unit 5H
- 43-35 Union St Unit 2M
- 43-35 Union St Unit 2G
- 13870 Elder Ave Unit 4S
- 43-20 Union St Unit 6D
- 143-16 Holly Ave
- 45-24 Burling St
- 4317 Union St Unit 2B
- 43-17 Union St Unit 6E
- 43-17 Union St Unit 6C
- 43-18 Robinson St Unit 7D
- 140-26 Cherry Ave Unit 5D
- 4523 Union St
- 4519 Union St
- 45-27 Union St
- 4527 Union St
- 4515 Union St
- 45-31 Union St Unit 1Fl
- 45-31 Union St
- 4531 Union St
- 45-28 Union St
- 4511 Union St
- 4526 Robinson St
- 4520 Robinson St
- 4524 Union St
- 4522 Union St
- 4528 Union St
- 4535 Union St
- 4516 Robinson St
- 4530 Union St
- 45-16 Robinson St Unit 2nd Fl
- 45-16 Robinson St
Your Personal Tour Guide
Ask me questions while you tour the home.