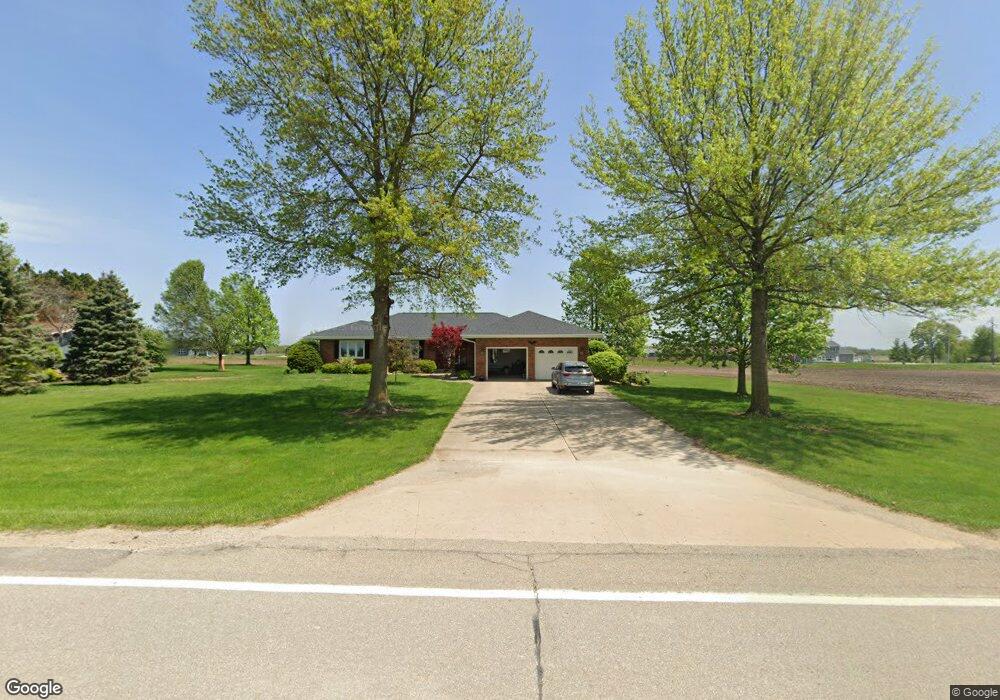
45 5th St West Point, IA 52656
Estimated Value: $330,000 - $351,915
3
Beds
3
Baths
1,702
Sq Ft
$200/Sq Ft
Est. Value
About This Home
This home is located at 45 5th St, West Point, IA 52656 and is currently estimated at $340,638, approximately $200 per square foot. 45 5th St is a home located in Lee County with nearby schools including Fort Madison High School, Holy Trinity Catholic Elementary, and Holy Trinity Elementary.
Ownership History
Date
Name
Owned For
Owner Type
Purchase Details
Closed on
Aug 11, 2015
Sold by
Dyer Gregory J and Dyer Michele M
Bought by
Schulte Anthony and Ammons Imelda M
Current Estimated Value
Home Financials for this Owner
Home Financials are based on the most recent Mortgage that was taken out on this home.
Original Mortgage
$265,500
Outstanding Balance
$208,243
Interest Rate
4.03%
Mortgage Type
Future Advance Clause Open End Mortgage
Estimated Equity
$132,395
Purchase Details
Closed on
May 9, 2013
Sold by
Mertens Joseph J
Bought by
Dyer Josephine
Home Financials for this Owner
Home Financials are based on the most recent Mortgage that was taken out on this home.
Original Mortgage
$190,509
Interest Rate
3.56%
Mortgage Type
Credit Line Revolving
Create a Home Valuation Report for This Property
The Home Valuation Report is an in-depth analysis detailing your home's value as well as a comparison with similar homes in the area
Home Values in the Area
Average Home Value in this Area
Purchase History
| Date | Buyer | Sale Price | Title Company |
|---|---|---|---|
| Schulte Anthony | $36,000 | None Available | |
| Schulte Anthony | $259,000 | None Available | |
| Dyer Josephine | $225,000 | None Available |
Source: Public Records
Mortgage History
| Date | Status | Borrower | Loan Amount |
|---|---|---|---|
| Open | Schulte Anthony | $265,500 | |
| Previous Owner | Dyer Josephine | $190,509 |
Source: Public Records
Tax History Compared to Growth
Tax History
| Year | Tax Paid | Tax Assessment Tax Assessment Total Assessment is a certain percentage of the fair market value that is determined by local assessors to be the total taxable value of land and additions on the property. | Land | Improvement |
|---|---|---|---|---|
| 2025 | $5,964 | $419,590 | $13,560 | $406,030 |
| 2024 | $5,964 | $345,850 | $13,560 | $332,290 |
| 2023 | $5,658 | $345,850 | $13,560 | $332,290 |
| 2022 | $3,948 | $257,900 | $13,560 | $244,340 |
| 2021 | $3,948 | $257,900 | $13,560 | $244,340 |
| 2020 | $3,854 | $238,790 | $14,370 | $224,420 |
| 2019 | $3,668 | $238,790 | $14,370 | $224,420 |
| 2018 | $3,778 | $225,280 | $0 | $0 |
| 2017 | $3,778 | $218,860 | $0 | $0 |
| 2014 | $3,550 | $187,000 | $0 | $0 |
Source: Public Records
Map
Nearby Homes
- 53 5th St
- 2280 Windmill Way
- 2257 Burt Rd
- 306 Franklin 5th St
- 2042 St Paul 2nd St
- 0 Blues Highway & Bluff Rd
- 4991 Bluff Rd
- 2229 235th St
- 2794 221st St
- 6119 Reve Ct
- 2329 263rd Ave
- 809 Houston Ave
- 4601 River Bend Sub Lot 4
- 2078 290th Ave
- 4945 Grand View Ln Unit 4945
- 1794 150th St
- 1123 48th St Unit 20
- RR Woodland Heights Ct
- 0 N Hillview Vil
- 4315 Avenue L