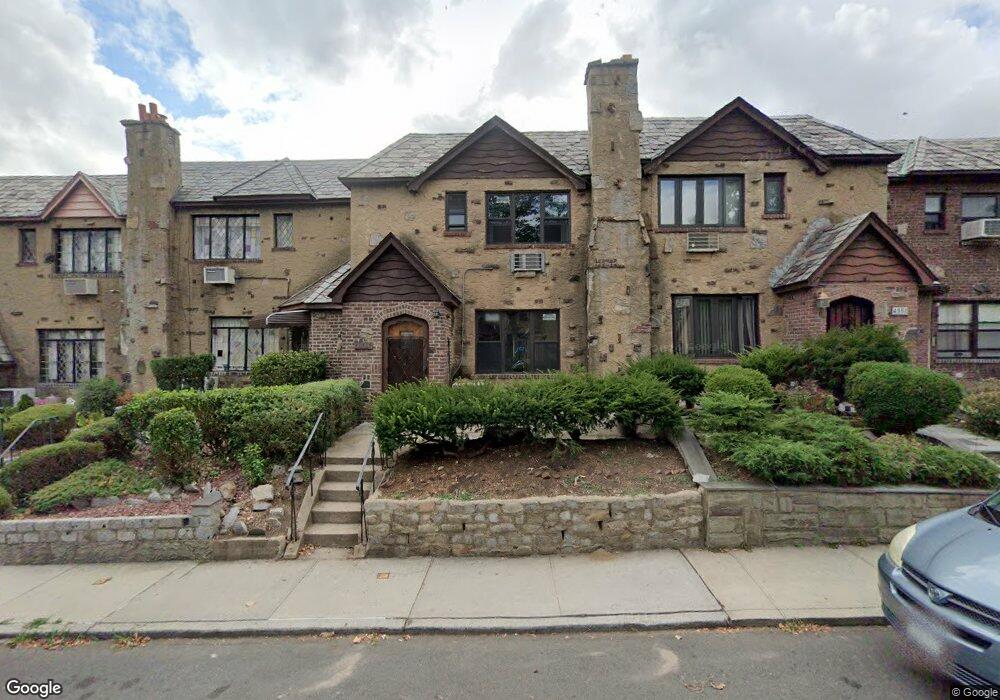
45-60 193rd St Flushing, NY 11358
Auburndale NeighborhoodEstimated Value: $900,000 - $1,030,000
3
Beds
3
Baths
1,600
Sq Ft
$609/Sq Ft
Est. Value
About This Home
This home is located at 45-60 193rd St, Flushing, NY 11358 and is currently estimated at $974,389, approximately $608 per square foot. 45-60 193rd St is a home located in Queens County with nearby schools including P.S. 107 Thomas A Dooley, I.S. 25 Adrien Block, and Francis Lewis High School.
Ownership History
Date
Name
Owned For
Owner Type
Purchase Details
Closed on
May 19, 2022
Sold by
Cosgrove Frances E and Urso Frances E
Bought by
Wang Ping
Current Estimated Value
Home Financials for this Owner
Home Financials are based on the most recent Mortgage that was taken out on this home.
Original Mortgage
$300,000
Outstanding Balance
$284,993
Interest Rate
5.25%
Mortgage Type
Purchase Money Mortgage
Estimated Equity
$689,396
Create a Home Valuation Report for This Property
The Home Valuation Report is an in-depth analysis detailing your home's value as well as a comparison with similar homes in the area
Home Values in the Area
Average Home Value in this Area
Purchase History
| Date | Buyer | Sale Price | Title Company |
|---|---|---|---|
| Wang Ping | $908,000 | -- |
Source: Public Records
Mortgage History
| Date | Status | Borrower | Loan Amount |
|---|---|---|---|
| Open | Wang Ping | $300,000 |
Source: Public Records
Tax History
| Year | Tax Paid | Tax Assessment Tax Assessment Total Assessment is a certain percentage of the fair market value that is determined by local assessors to be the total taxable value of land and additions on the property. | Land | Improvement |
|---|---|---|---|---|
| 2025 | $9,156 | $48,318 | $15,725 | $32,593 |
| 2024 | $9,156 | $45,584 | $13,928 | $31,656 |
| 2023 | $8,857 | $44,098 | $13,153 | $30,945 |
| 2022 | $6,229 | $52,680 | $16,500 | $36,180 |
| 2021 | $8,755 | $55,560 | $16,500 | $39,060 |
| 2020 | $8,523 | $53,520 | $16,500 | $37,020 |
| 2019 | $7,947 | $53,820 | $16,500 | $37,320 |
| 2018 | $7,193 | $36,748 | $11,806 | $24,942 |
| 2017 | $6,768 | $34,669 | $12,780 | $21,889 |
| 2016 | $6,621 | $34,669 | $12,780 | $21,889 |
| 2015 | $3,725 | $33,554 | $15,006 | $18,548 |
| 2014 | $3,725 | $31,656 | $16,012 | $15,644 |
Source: Public Records
Map
Nearby Homes
- 45-47 193rd St
- 4539 192nd St
- 4604 195th St
- 45-31 195th St
- 4552 196th St
- 45-66 196th Place
- 43-44 195th St
- 47-55 194th St
- 4719 192nd St
- 43-28 196th St
- 47-49 194th St
- 47-18 190th St
- 196-64 45th Ave
- 4756 196th St
- 45-32 Utopia Pkwy
- 19005 48th Ave
- 188-02 Northern Blvd
- 199-04 47th Ave
- 47-02 Francis Lewis Blvd
- 4818 190th St
Your Personal Tour Guide
Ask me questions while you tour the home.