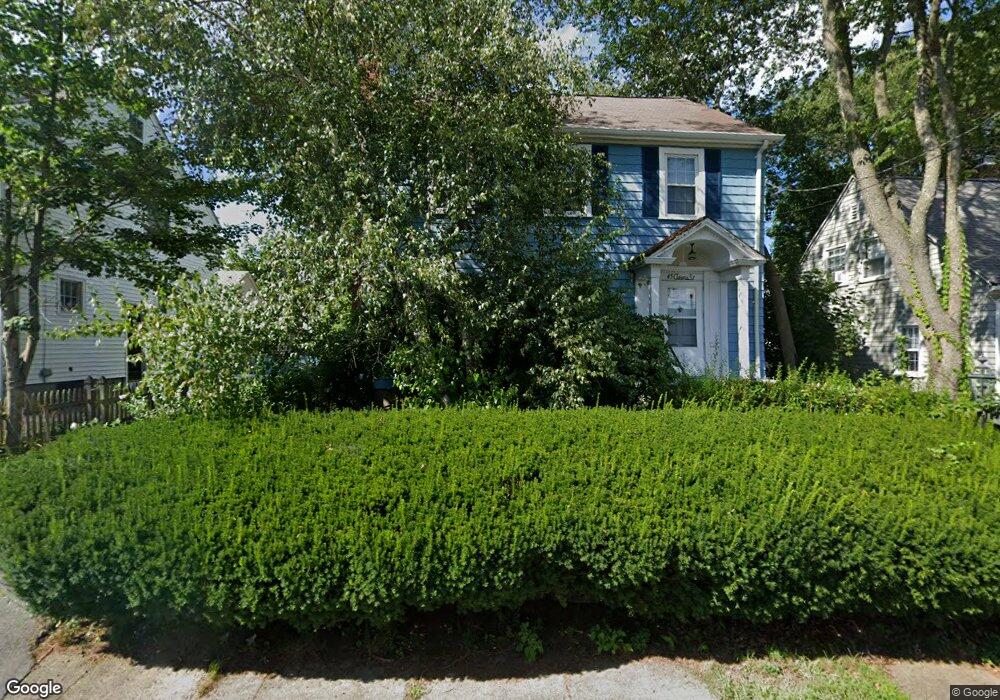
45 Adams St Warwick, RI 02888
Palace Garden NeighborhoodEstimated Value: $464,000 - $495,000
3
Beds
2
Baths
1,664
Sq Ft
$285/Sq Ft
Est. Value
About This Home
This home is located at 45 Adams St, Warwick, RI 02888 and is currently estimated at $474,231, approximately $284 per square foot. 45 Adams St is a home located in Kent County with nearby schools including St. Peter School and Saint Paul School.
Ownership History
Date
Name
Owned For
Owner Type
Purchase Details
Closed on
Apr 10, 2024
Sold by
Equity T Co Custodian
Bought by
Oyler Seth T and Ward Chantelle M
Current Estimated Value
Home Financials for this Owner
Home Financials are based on the most recent Mortgage that was taken out on this home.
Original Mortgage
$352,000
Outstanding Balance
$345,146
Interest Rate
6.38%
Mortgage Type
Purchase Money Mortgage
Estimated Equity
$129,085
Purchase Details
Closed on
Mar 8, 2024
Sold by
Barton Buell R Est and Rowland
Bought by
Equity T Co
Home Financials for this Owner
Home Financials are based on the most recent Mortgage that was taken out on this home.
Original Mortgage
$352,000
Outstanding Balance
$345,146
Interest Rate
6.38%
Mortgage Type
Purchase Money Mortgage
Estimated Equity
$129,085
Purchase Details
Closed on
Oct 30, 1991
Sold by
Barton David E
Bought by
Barton Buell R
Create a Home Valuation Report for This Property
The Home Valuation Report is an in-depth analysis detailing your home's value as well as a comparison with similar homes in the area
Home Values in the Area
Average Home Value in this Area
Purchase History
| Date | Buyer | Sale Price | Title Company |
|---|---|---|---|
| Oyler Seth T | $445,000 | None Available | |
| Equity T Co | $370,000 | None Available | |
| Barton Buell R | $20,000 | -- | |
| Barton Buell R | $20,000 | -- |
Source: Public Records
Mortgage History
| Date | Status | Borrower | Loan Amount |
|---|---|---|---|
| Open | Oyler Seth T | $352,000 | |
| Previous Owner | Barton Buell R | $100,000 | |
| Previous Owner | Barton Buell R | $10,000 |
Source: Public Records
Tax History
| Year | Tax Paid | Tax Assessment Tax Assessment Total Assessment is a certain percentage of the fair market value that is determined by local assessors to be the total taxable value of land and additions on the property. | Land | Improvement |
|---|---|---|---|---|
| 2025 | $5,089 | $400,700 | $127,800 | $272,900 |
| 2024 | $5,509 | $380,700 | $111,100 | $269,600 |
| 2023 | $5,402 | $380,700 | $111,100 | $269,600 |
| 2022 | $5,160 | $275,500 | $69,900 | $205,600 |
| 2021 | $5,160 | $275,500 | $69,900 | $205,600 |
| 2020 | $5,160 | $275,500 | $69,900 | $205,600 |
| 2019 | $5,160 | $275,500 | $69,900 | $205,600 |
| 2018 | $4,936 | $237,300 | $69,900 | $167,400 |
| 2017 | $4,803 | $237,300 | $69,900 | $167,400 |
| 2016 | $4,803 | $237,300 | $69,900 | $167,400 |
| 2015 | $4,584 | $220,900 | $85,000 | $135,900 |
| 2014 | $4,431 | $220,900 | $85,000 | $135,900 |
| 2013 | $4,372 | $220,900 | $85,000 | $135,900 |
Source: Public Records
Map
Nearby Homes
- 200 Post Rd Unit 419
- 28 Manchester St
- 0 Remington St
- 408 Fair St
- 56 Errol St
- 400 Narragansett Pkwy Unit WA11
- 400 Narragansett Pkwy Unit NB1
- 400 Narragansett Pkwy Unit SC7
- 34 N Country Club Dr
- 27 Vickery St
- 210 Irving Rd
- 115 Irving Rd
- 1020 Warwick Ave
- 94 Holmes Rd
- 25 Newfield Ave
- 63 Benbridge Ave
- 40 Lane 1
- 29 Malvern Ave
- 172 Bluff Ave
- 136 Sherwood Ave
Your Personal Tour Guide
Ask me questions while you tour the home.