Estimated Value: $824,844 - $886,000
4
Beds
5
Baths
4,804
Sq Ft
$178/Sq Ft
Est. Value
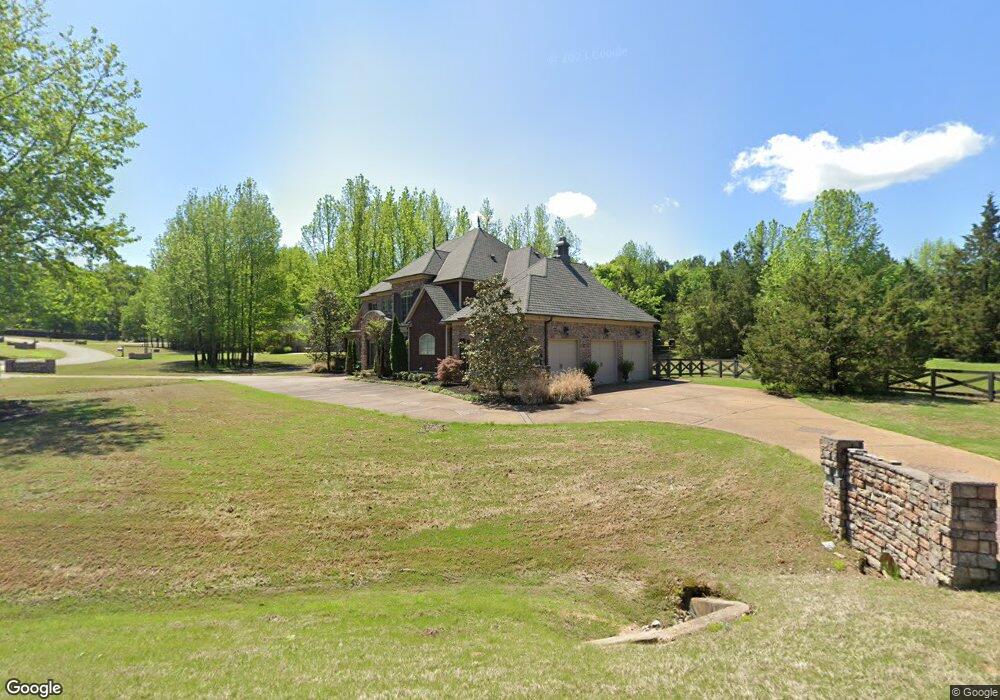
About This Home
This home is located at 45 Aston Brook Cove, Eads, TN 38028 and is currently estimated at $855,948, approximately $178 per square foot. 45 Aston Brook Cove is a home located in Fayette County with nearby schools including Oakland Elementary School, West Junior High School, and Fayette Ware Comprehensive High School.
Ownership History
Date
Name
Owned For
Owner Type
Purchase Details
Closed on
May 8, 2015
Sold by
Brinson Christine A
Bought by
Brinson William H
Current Estimated Value
Home Financials for this Owner
Home Financials are based on the most recent Mortgage that was taken out on this home.
Original Mortgage
$411,200
Outstanding Balance
$317,576
Interest Rate
3.75%
Mortgage Type
New Conventional
Estimated Equity
$538,372
Purchase Details
Closed on
Feb 26, 2007
Sold by
Barry Watson Homes Llc
Bought by
Brinson William H
Home Financials for this Owner
Home Financials are based on the most recent Mortgage that was taken out on this home.
Original Mortgage
$417,000
Interest Rate
6.19%
Mortgage Type
New Conventional
Purchase Details
Closed on
Sep 28, 2005
Bought by
Belk Watson Homes Llc
Create a Home Valuation Report for This Property
The Home Valuation Report is an in-depth analysis detailing your home's value as well as a comparison with similar homes in the area
Home Values in the Area
Average Home Value in this Area
Purchase History
| Date | Buyer | Sale Price | Title Company |
|---|---|---|---|
| Brinson William H | -- | -- | |
| Brinson William H | $624,900 | -- | |
| Brinson William H | $624,900 | -- | |
| Belk Watson Homes Llc | $855,500 | -- |
Source: Public Records
Mortgage History
| Date | Status | Borrower | Loan Amount |
|---|---|---|---|
| Open | Brinson William H | $411,200 | |
| Previous Owner | Brinson William H | $417,000 |
Source: Public Records
Tax History Compared to Growth
Tax History
| Year | Tax Paid | Tax Assessment Tax Assessment Total Assessment is a certain percentage of the fair market value that is determined by local assessors to be the total taxable value of land and additions on the property. | Land | Improvement |
|---|---|---|---|---|
| 2024 | $2,104 | $162,900 | $27,075 | $135,825 |
| 2023 | $2,104 | $162,900 | $0 | $0 |
| 2022 | $2,104 | $162,900 | $27,075 | $135,825 |
| 2021 | $2,104 | $162,900 | $27,075 | $135,825 |
| 2020 | $2,140 | $162,900 | $27,075 | $135,825 |
| 2019 | $2,140 | $141,975 | $27,075 | $114,900 |
| 2018 | $2,140 | $141,975 | $27,075 | $114,900 |
| 2017 | $2,160 | $143,275 | $27,075 | $116,200 |
| 2016 | $2,154 | $134,150 | $23,650 | $110,500 |
| 2015 | $2,154 | $134,150 | $23,650 | $110,500 |
| 2014 | $2,154 | $134,150 | $23,650 | $110,500 |
Source: Public Records
Map
Nearby Homes
- 105 Aston Brook Cove
- 100 Aston Park Dr
- 190 Aston Brook Cove
- 105 Aston Cross Dr
- 360 Catalpa Dr
- 615 Stewart Rd
- 120 Blueberry Rd
- 205 Estate Dr
- 26 Catalpa Dr
- 25 Branston Cove
- 535 Aston Cross Dr
- 100 Whitehall Ct
- 450 Cherry Rd
- 55 Coach Trail
- 50 Woodwind Cove
- 75 Breezy Meadows Cove
- 580 Hickory Lake Rd
- 630 Hickory Lake Rd
- 20 Fair Meadows Ln
- 4237 Hickory Run Place
- 20 Aston Brook Cove
- 135 Aston Park Dr
- 20 Aston Park Dr
- 40 Aston Brook Cove
- 70 Aston Brook Cove
- 265 Aston Hall Dr
- 90 Aston Brook Cove
- 265 Aston Park Dr
- 270 Aston Hall Dr
- 95 Aston Park Dr
- 135 Aston Brook Cove
- 120 Aston Brook Cove
- 30 Coventry Cove
- 230 Aston Hall Dr
- 40 Kingston Cove
- 160 Aston Brook Cove
- 165 Aston Brook Cove
- 25 Coventry Cove
- 200 Aston Hall Dr
- 85 Aston Park Dr