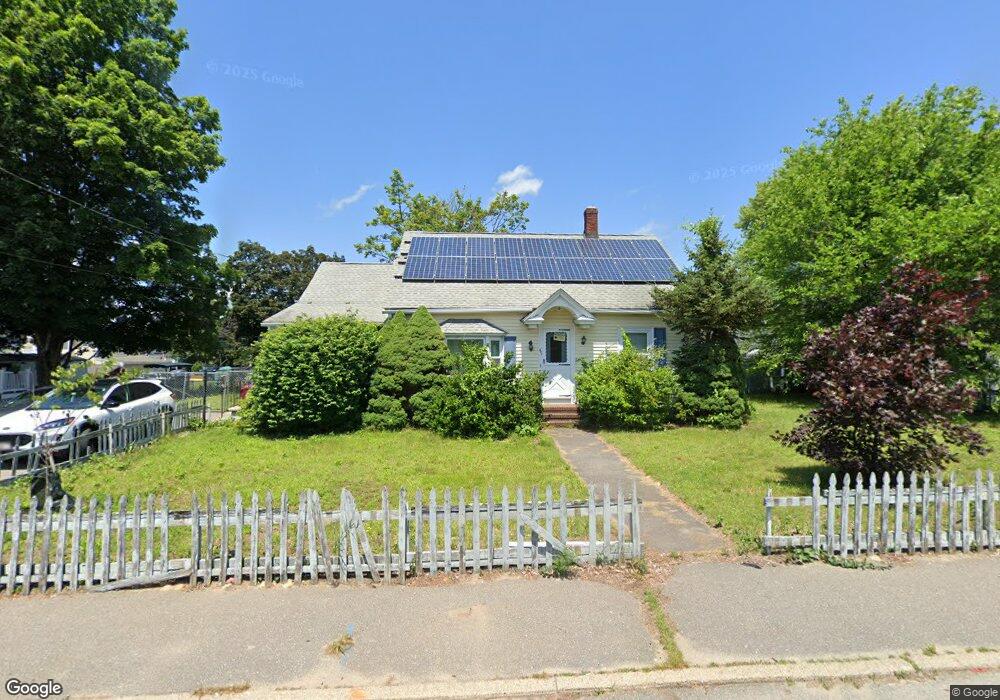
45 Bodwell Ave Lowell, MA 01854
Pawtucketville NeighborhoodEstimated Value: $479,000 - $552,094
3
Beds
1
Bath
1,800
Sq Ft
$294/Sq Ft
Est. Value
About This Home
This home is located at 45 Bodwell Ave, Lowell, MA 01854 and is currently estimated at $528,524, approximately $293 per square foot. 45 Bodwell Ave is a home located in Middlesex County with nearby schools including Joseph McAvinnue Elementary School, Charlotte M. Murkland Elementary School, and Charles W. Morey Elementary School.
Ownership History
Date
Name
Owned For
Owner Type
Purchase Details
Closed on
Oct 26, 1999
Sold by
Cloutier Robert C and Cloutier Carol A
Bought by
Loiselle Richard F
Current Estimated Value
Home Financials for this Owner
Home Financials are based on the most recent Mortgage that was taken out on this home.
Original Mortgage
$143,110
Interest Rate
7.83%
Mortgage Type
Purchase Money Mortgage
Purchase Details
Closed on
Aug 4, 1995
Sold by
Leclair Richard and Leclair Loretta
Bought by
Cloutier Robert C and Cloutier Carol
Create a Home Valuation Report for This Property
The Home Valuation Report is an in-depth analysis detailing your home's value as well as a comparison with similar homes in the area
Home Values in the Area
Average Home Value in this Area
Purchase History
| Date | Buyer | Sale Price | Title Company |
|---|---|---|---|
| Loiselle Richard F | $145,000 | -- | |
| Loiselle Richard F | $145,000 | -- | |
| Cloutier Robert C | $95,000 | -- | |
| Cloutier Robert C | $95,000 | -- |
Source: Public Records
Mortgage History
| Date | Status | Borrower | Loan Amount |
|---|---|---|---|
| Open | Cloutier Robert C | $147,000 | |
| Closed | Cloutier Robert C | $8,887 | |
| Closed | Cloutier Robert C | $143,110 |
Source: Public Records
Tax History
| Year | Tax Paid | Tax Assessment Tax Assessment Total Assessment is a certain percentage of the fair market value that is determined by local assessors to be the total taxable value of land and additions on the property. | Land | Improvement |
|---|---|---|---|---|
| 2025 | $5,797 | $505,000 | $214,600 | $290,400 |
| 2024 | $5,427 | $455,700 | $187,200 | $268,500 |
| 2023 | $5,200 | $418,700 | $155,500 | $263,200 |
| 2022 | $4,785 | $377,100 | $141,300 | $235,800 |
| 2021 | $4,501 | $334,400 | $122,900 | $211,500 |
| 2020 | $4,325 | $323,700 | $114,900 | $208,800 |
| 2019 | $4,227 | $301,100 | $106,400 | $194,700 |
| 2018 | $4,078 | $283,400 | $101,300 | $182,100 |
| 2017 | $3,906 | $261,800 | $92,100 | $169,700 |
| 2016 | $3,641 | $240,200 | $77,200 | $163,000 |
| 2015 | $3,653 | $236,000 | $78,900 | $157,100 |
| 2013 | $3,524 | $234,800 | $97,400 | $137,400 |
Source: Public Records
Map
Nearby Homes
- 39 Phoebe Ave
- 28 Sarah Ave
- 101 Dracut St
- 81 4th Ave
- 94 Hampson St
- 30 4th Ave
- 89 Mammoth Rd
- 930 Lakeview Ave
- 75 Sladen St
- 169 Salem St
- 35 Riverwalk Way Unit 103
- 79 School St Unit 4
- 63 Bowers St
- 70 Austin St Unit 15
- 26 Farmland Rd Unit C
- 101 Donohue Rd Unit 19
- 104 Woodward Ave
- 105 Columbia Rd
- 52 Lawrence Dr Unit 206
- 38 Starbird St
- 37 Bodwell Ave
- 53 Bodwell Ave
- 159 Gershom Ave
- 160 Emery Ave
- 172 Emery Ave
- 31 Bodwell Ave
- 61 Bodwell Ave
- 156 Gershom Ave
- 151-153 Gershom Ave Unit 151
- 150 Emery Ave
- 36 Bodwell Ave
- 60 Bodwell Ave
- 149 Gershom Ave
- 32 Bodwell Ave
- 182 Emery Ave
- 152 Gershom Ave
- 144 Emery Ave
- 23 Bodwell Ave
- 147 Gershom Ave
- 255 White St
Your Personal Tour Guide
Ask me questions while you tour the home.