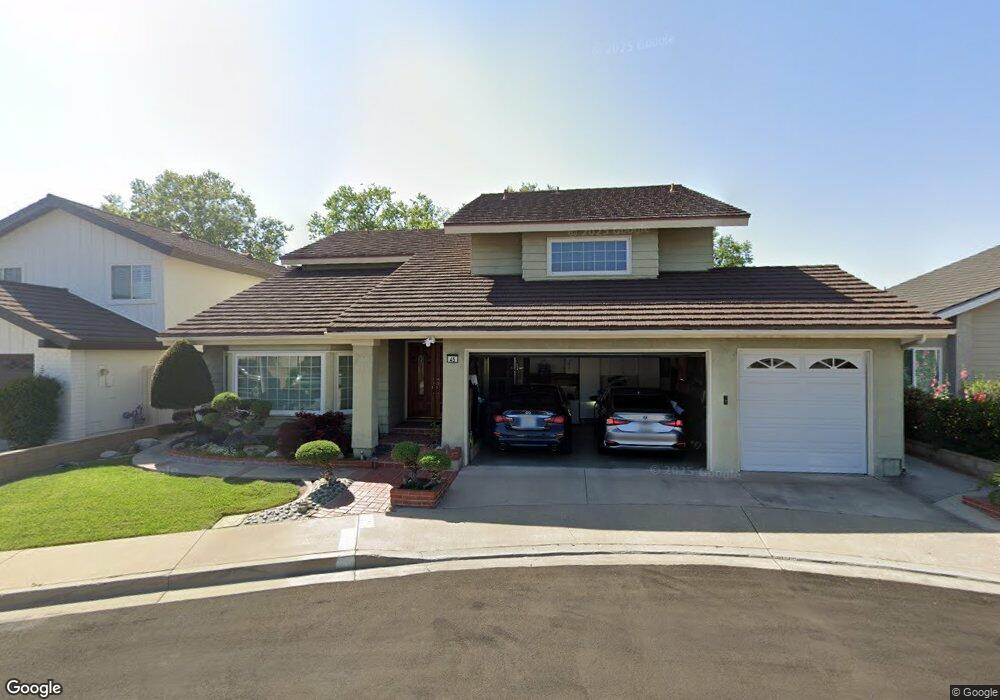
45 Bull Run Irvine, CA 92620
Northwood NeighborhoodEstimated Value: $1,890,251 - $1,975,000
4
Beds
3
Baths
2,635
Sq Ft
$738/Sq Ft
Est. Value
About This Home
This home is located at 45 Bull Run, Irvine, CA 92620 and is currently estimated at $1,943,813, approximately $737 per square foot. 45 Bull Run is a home located in Orange County with nearby schools including Brywood Elementary School, Sierra Vista Middle School, and Northwood High School.
Ownership History
Date
Name
Owned For
Owner Type
Purchase Details
Closed on
Sep 22, 2021
Sold by
Richard Leslie T and Nakase Richard Emi
Bought by
Richard Leslie T and Nakase Richard Emi
Current Estimated Value
Purchase Details
Closed on
Jan 17, 1996
Sold by
Ilustrisimo Juan Y and Ilustrisimo Clarissa L
Bought by
Richard Leslie T and Nakase Richard Emi
Home Financials for this Owner
Home Financials are based on the most recent Mortgage that was taken out on this home.
Original Mortgage
$207,000
Outstanding Balance
$5,483
Interest Rate
7.1%
Estimated Equity
$1,938,330
Purchase Details
Closed on
Sep 28, 1992
Sold by
Ilustrisimo Juan Y and Ilustrisimo Clarissa L
Bought by
Ilustrisimo Juan Y and Ilustrisimo Clarissa L
Home Financials for this Owner
Home Financials are based on the most recent Mortgage that was taken out on this home.
Original Mortgage
$266,000
Interest Rate
7.74%
Create a Home Valuation Report for This Property
The Home Valuation Report is an in-depth analysis detailing your home's value as well as a comparison with similar homes in the area
Home Values in the Area
Average Home Value in this Area
Purchase History
| Date | Buyer | Sale Price | Title Company |
|---|---|---|---|
| Richard Leslie T | -- | None Available | |
| Richard Leslie T | $286,000 | Chicago Title Co | |
| Ilustrisimo Juan Y | -- | South Coast Title Company |
Source: Public Records
Mortgage History
| Date | Status | Borrower | Loan Amount |
|---|---|---|---|
| Open | Richard Leslie T | $207,000 | |
| Previous Owner | Ilustrisimo Juan Y | $266,000 |
Source: Public Records
Tax History Compared to Growth
Tax History
| Year | Tax Paid | Tax Assessment Tax Assessment Total Assessment is a certain percentage of the fair market value that is determined by local assessors to be the total taxable value of land and additions on the property. | Land | Improvement |
|---|---|---|---|---|
| 2025 | $4,969 | $475,113 | $214,467 | $260,646 |
| 2024 | $4,969 | $465,798 | $210,262 | $255,536 |
| 2023 | $4,840 | $456,665 | $206,139 | $250,526 |
| 2022 | $4,743 | $447,711 | $202,097 | $245,614 |
| 2021 | $4,632 | $438,933 | $198,134 | $240,799 |
| 2020 | $4,605 | $434,433 | $196,103 | $238,330 |
| 2019 | $4,502 | $425,915 | $192,258 | $233,657 |
| 2018 | $4,420 | $417,564 | $188,488 | $229,076 |
| 2017 | $4,328 | $409,377 | $184,792 | $224,585 |
| 2016 | $4,137 | $401,350 | $181,168 | $220,182 |
| 2015 | $4,075 | $395,322 | $178,447 | $216,875 |
| 2014 | $3,996 | $387,579 | $174,952 | $212,627 |
Source: Public Records
Map
Nearby Homes