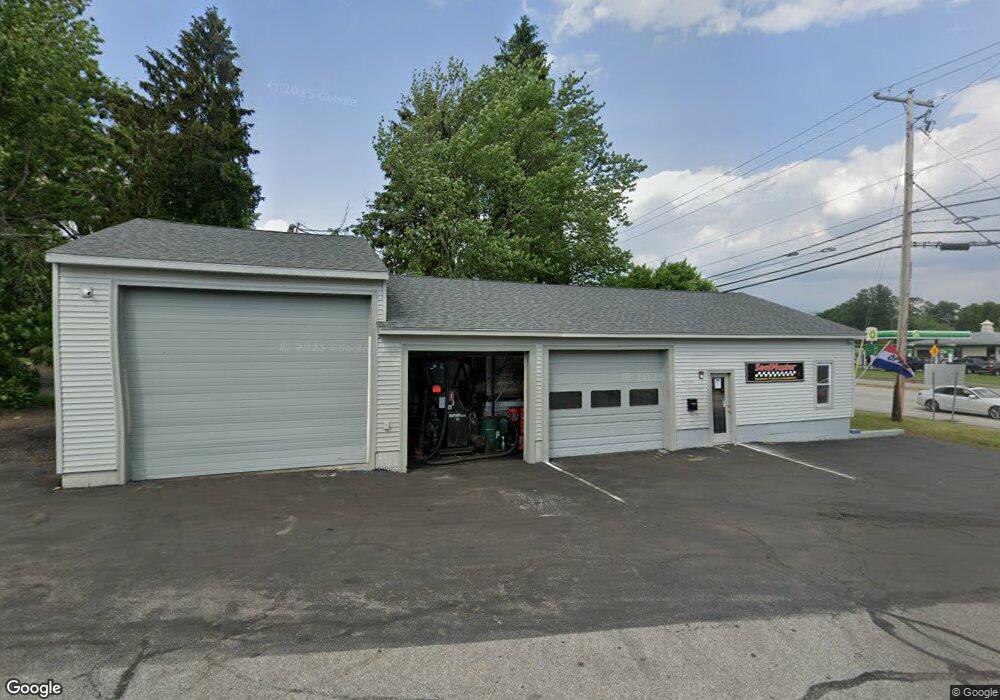
45 Buttrick Rd Londonderry, NH 03053
Estimated Value: $308,021
--
Bed
1
Bath
2,236
Sq Ft
$138/Sq Ft
Est. Value
About This Home
This home is located at 45 Buttrick Rd, Londonderry, NH 03053 and is currently estimated at $308,021, approximately $137 per square foot. 45 Buttrick Rd is a home located in Rockingham County with nearby schools including Matthew Thornton Elementary School, Londonderry Middle School, and Londonderry Senior High School.
Ownership History
Date
Name
Owned For
Owner Type
Purchase Details
Closed on
Feb 9, 2017
Sold by
Markakis Louis
Bought by
Pia Rt 2
Current Estimated Value
Purchase Details
Closed on
Oct 9, 2012
Sold by
Rhp Investments Llc
Bought by
Action Nh Rt and Zaccaria Michael
Purchase Details
Closed on
Mar 26, 2007
Sold by
Esgr Llc
Bought by
Bilc Gabriel
Home Financials for this Owner
Home Financials are based on the most recent Mortgage that was taken out on this home.
Original Mortgage
$183,600
Interest Rate
6.33%
Mortgage Type
Commercial
Purchase Details
Closed on
Mar 9, 2007
Sold by
Londonderry Town Of
Bought by
Esgr Llc
Home Financials for this Owner
Home Financials are based on the most recent Mortgage that was taken out on this home.
Original Mortgage
$183,600
Interest Rate
6.33%
Mortgage Type
Commercial
Create a Home Valuation Report for This Property
The Home Valuation Report is an in-depth analysis detailing your home's value as well as a comparison with similar homes in the area
Home Values in the Area
Average Home Value in this Area
Purchase History
| Date | Buyer | Sale Price | Title Company |
|---|---|---|---|
| Pia Rt 2 | $150,000 | -- | |
| Pia Rt 2 | $150,000 | -- | |
| Action Nh Rt | $190,000 | -- | |
| Action Nh Rt | $190,000 | -- | |
| Bilc Gabriel | $190,000 | -- | |
| Bilc Gabriel | $190,000 | -- | |
| Esgr Llc | $50,200 | -- | |
| Esgr Llc | $50,200 | -- |
Source: Public Records
Mortgage History
| Date | Status | Borrower | Loan Amount |
|---|---|---|---|
| Previous Owner | Esgr Llc | $600,000 | |
| Previous Owner | Esgr Llc | $183,600 |
Source: Public Records
Tax History Compared to Growth
Tax History
| Year | Tax Paid | Tax Assessment Tax Assessment Total Assessment is a certain percentage of the fair market value that is determined by local assessors to be the total taxable value of land and additions on the property. | Land | Improvement |
|---|---|---|---|---|
| 2024 | $3,084 | $191,100 | $108,200 | $82,900 |
| 2023 | $2,991 | $191,100 | $108,200 | $82,900 |
| 2022 | $2,857 | $154,600 | $81,400 | $73,200 |
| 2021 | $2,842 | $154,600 | $81,400 | $73,200 |
| 2020 | $3,660 | $182,000 | $93,400 | $88,600 |
| 2019 | $3,529 | $182,000 | $93,400 | $88,600 |
| 2018 | $3,364 | $154,300 | $82,700 | $71,600 |
| 2017 | $3,334 | $154,300 | $82,700 | $71,600 |
| 2016 | $3,317 | $154,300 | $82,700 | $71,600 |
| 2015 | $3,243 | $154,300 | $82,700 | $71,600 |
| 2014 | $3,254 | $154,300 | $82,700 | $71,600 |
| 2011 | -- | $129,900 | $57,500 | $72,400 |
Source: Public Records
Map
Nearby Homes
- 74 Boulder Dr Unit 74
- 77 Granite St
- 64 Boulder Dr
- 7 Gardner Cir
- 97 Granite St
- 1 Lily Ln
- 124 Capitol Hill Dr
- 119I Capitol Hill Dr
- 14 Reed St
- 5 Elise Ave Unit Lot 94
- 23a Reed St
- 111 Winterwood Dr
- 38 Winterwood Dr
- 25 Winterwood Dr
- 21 Winterwood Dr
- 171 Londonderry Rd
- 34 Pleasant Dr
- 150 Kendall Pond Rd
- 7 Oakwood St
- 3 Elise Ave Unit 95
- 176 Mammoth Rd
- 41 Buttrick Road C-678 Rd
- 41 Buttrick Rd Unit Rd
- 41 Buttrick Rd
- 184 Mammoth Rd Unit 3
- 184 Mammoth Rd Unit 2
- 184 Mammoth Rd Unit 1-3
- 184 Mammoth Rd Unit 1
- 184 Mammoth Rd
- 184 Mammoth Rd
- 184 Mammoth Rd
- 184 Mammoth Rd Unit D
- 184 Mammoth Rd Unit D
- 184 Mammoth Rd Unit D
- 184 Mammoth Rd Unit 2-3 (2B-2C)
- 184 Mammoth Rd
- 184 Mammoth Rd Unit 2-3 (2A-2C)
- 184 Mammoth Rd Unit 2 (2B)
- 184 Mammoth Rd Unit 3 (2C)
- 184 Mammoth Rd Unit 1 (2A)