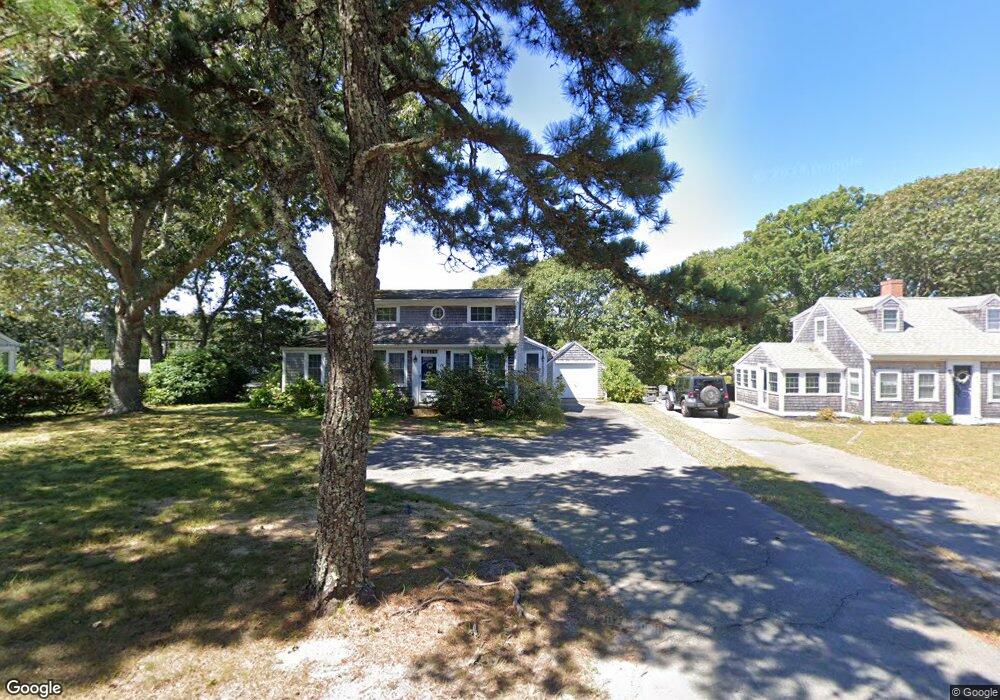
45 Caleb St West Harwich, MA 02671
Dennis Port NeighborhoodEstimated Value: $700,000 - $1,116,000
3
Beds
2
Baths
1,704
Sq Ft
$509/Sq Ft
Est. Value
About This Home
This home is located at 45 Caleb St, West Harwich, MA 02671 and is currently estimated at $867,139, approximately $508 per square foot. 45 Caleb St is a home located in Barnstable County with nearby schools including Dennis-Yarmouth Regional High School and St. Pius X. School.
Ownership History
Date
Name
Owned For
Owner Type
Purchase Details
Closed on
Feb 2, 2023
Sold by
Burgoyne Catherine A and Waters Francis
Bought by
Waters Brian H
Current Estimated Value
Purchase Details
Closed on
Sep 25, 2015
Sold by
Waters Lorna
Bought by
Waters Cape House Nt and Waters
Create a Home Valuation Report for This Property
The Home Valuation Report is an in-depth analysis detailing your home's value as well as a comparison with similar homes in the area
Home Values in the Area
Average Home Value in this Area
Purchase History
| Date | Buyer | Sale Price | Title Company |
|---|---|---|---|
| Waters Brian H | $490,000 | None Available | |
| Waters Brian H | $490,000 | None Available | |
| Burgoyne Catherine A | -- | None Available | |
| Burgoyne Catherine A | -- | None Available | |
| Waters Cape House Nt | -- | -- | |
| Waters Cape House Nt | -- | -- |
Source: Public Records
Tax History Compared to Growth
Tax History
| Year | Tax Paid | Tax Assessment Tax Assessment Total Assessment is a certain percentage of the fair market value that is determined by local assessors to be the total taxable value of land and additions on the property. | Land | Improvement |
|---|---|---|---|---|
| 2025 | $3,414 | $788,400 | $321,100 | $467,300 |
| 2024 | $3,325 | $757,500 | $308,800 | $448,700 |
| 2023 | $3,216 | $688,600 | $280,700 | $407,900 |
| 2022 | $2,927 | $522,700 | $221,300 | $301,400 |
| 2021 | $2,575 | $471,900 | $216,900 | $255,000 |
| 2020 | $2,528 | $457,400 | $216,900 | $240,500 |
| 2019 | $0 | $450,600 | $230,900 | $219,700 |
| 2018 | $2,215 | $432,300 | $219,800 | $212,500 |
| 2017 | $2,552 | $415,000 | $202,500 | $212,500 |
| 2016 | $2,431 | $372,300 | $190,900 | $181,400 |
| 2015 | $2,383 | $372,300 | $190,900 | $181,400 |
| 2014 | $2,254 | $354,900 | $179,300 | $175,600 |
Source: Public Records
Map
Nearby Homes
- 1 Belmont Rd Unit 630
- 1 Belmont Rd Unit 513
- 1 E Belmont Unit 630
- 26 Manning Rd
- 3 Fairbanks Dr
- 11 Ocean Park W
- 9 Chase Ave Unit 6
- 159 Center St Unit 22
- 73 Division St
- 148 Belmont Rd
- 12 Cross St
- 402 Old Wharf Rd
- 402 Old Wharf Rd
- 19 Riverway
- 405 Old Wharf Rd Unit B204
- 405 Old Wharf Rd Unit B204
- 19 Riverway
- 24 Chase St
- 24 Chase St
- 40 Willow St