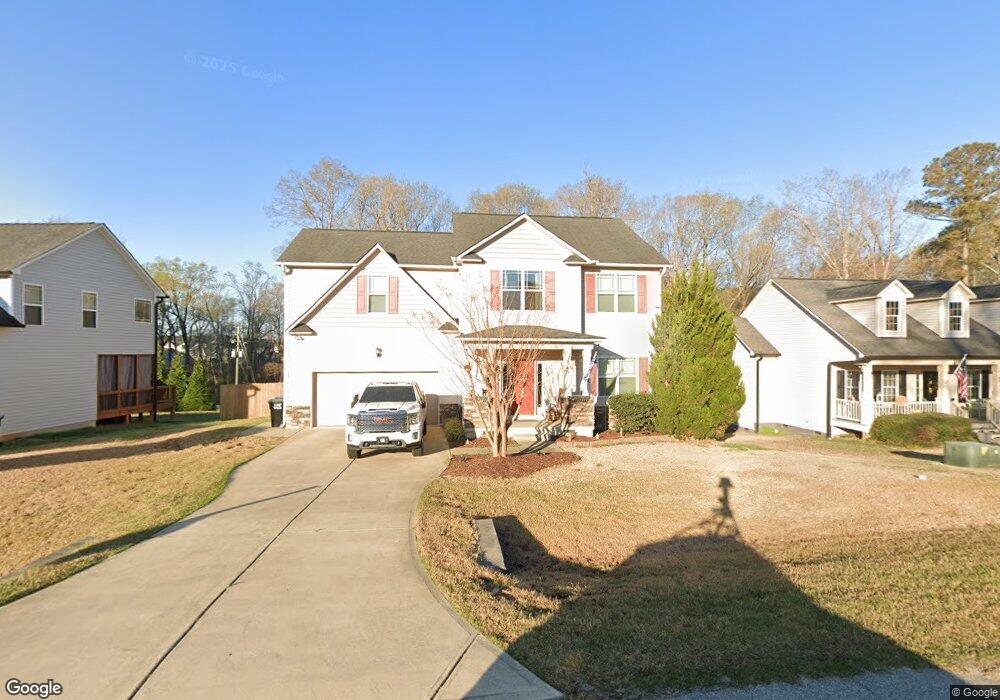
45 Carson Dr Unit HEATH Garner, NC 27529
Estimated Value: $392,000 - $402,036
3
Beds
3
Baths
2,200
Sq Ft
$181/Sq Ft
Est. Value
About This Home
This home is located at 45 Carson Dr Unit HEATH, Garner, NC 27529 and is currently estimated at $398,009, approximately $180 per square foot. 45 Carson Dr Unit HEATH is a home located in Johnston County with nearby schools including Cleveland Elementary School, Cleveland Middle School, and Cleveland High School.
Ownership History
Date
Name
Owned For
Owner Type
Purchase Details
Closed on
Jul 6, 2020
Sold by
Stalder Brian and Stalder Christina
Bought by
Barwell Destry T
Current Estimated Value
Home Financials for this Owner
Home Financials are based on the most recent Mortgage that was taken out on this home.
Original Mortgage
$266,666
Outstanding Balance
$236,462
Interest Rate
3.1%
Mortgage Type
New Conventional
Estimated Equity
$161,547
Purchase Details
Closed on
Jul 16, 2014
Sold by
Golden Properties & Development Inc
Bought by
Stalder Briar and Stalder Christina
Home Financials for this Owner
Home Financials are based on the most recent Mortgage that was taken out on this home.
Original Mortgage
$198,553
Interest Rate
4.24%
Mortgage Type
VA
Purchase Details
Closed on
May 15, 2013
Sold by
Capital Properties Of Raleigh Ii Llc
Bought by
Golden Properties & Development Inc
Create a Home Valuation Report for This Property
The Home Valuation Report is an in-depth analysis detailing your home's value as well as a comparison with similar homes in the area
Home Values in the Area
Average Home Value in this Area
Purchase History
| Date | Buyer | Sale Price | Title Company |
|---|---|---|---|
| Barwell Destry T | $264,000 | None Available | |
| Stalder Briar | $194,000 | None Available | |
| Golden Properties & Development Inc | $90,000 | None Available |
Source: Public Records
Mortgage History
| Date | Status | Borrower | Loan Amount |
|---|---|---|---|
| Open | Barwell Destry T | $266,666 | |
| Previous Owner | Stalder Briar | $198,553 |
Source: Public Records
Tax History
| Year | Tax Paid | Tax Assessment Tax Assessment Total Assessment is a certain percentage of the fair market value that is determined by local assessors to be the total taxable value of land and additions on the property. | Land | Improvement |
|---|---|---|---|---|
| 2025 | $2,451 | $386,010 | $85,000 | $301,010 |
| 2024 | $2,048 | $252,900 | $55,000 | $197,900 |
| 2023 | $1,932 | $246,850 | $55,000 | $191,850 |
| 2022 | $2,030 | $246,850 | $55,000 | $191,850 |
| 2021 | $2,030 | $246,850 | $55,000 | $191,850 |
| 2020 | $2,055 | $246,850 | $55,000 | $191,850 |
| 2019 | $2,055 | $246,850 | $55,000 | $191,850 |
| 2018 | $1,680 | $197,120 | $30,000 | $167,120 |
| 2017 | $1,680 | $197,120 | $30,000 | $167,120 |
| 2016 | $1,680 | $197,120 | $30,000 | $167,120 |
| 2015 | $759 | $197,120 | $30,000 | $167,120 |
| 2014 | $759 | $89,040 | $30,000 | $59,040 |
Source: Public Records
Map
Nearby Homes
- 98 Fairbanks Ave
- 172 Fairbanks Ave
- 76 Fairbanks Ave
- 93 Kinsale Ct
- 77 Ravensworth Dr
- 136 Newport Landing
- 361 Ravensworth Dr
- 61 Merrifield Ln
- 119 Fairbanks Ave
- 77 Fairbanks Ave
- 97 Fairbanks Ave
- 208 Fairbanks Ave
- 57 Fairbanks Ave
- 66 Tennyson Dr
- 129 Merrifield Ln Unit Lot 119
- 167 Merrifield Ln Unit 121
- 226 Fairbanks Ave
- 122 Royal Oak Ln
- 467 Ravensworth Dr
- 228 Tennyson Dr
Your Personal Tour Guide
Ask me questions while you tour the home.