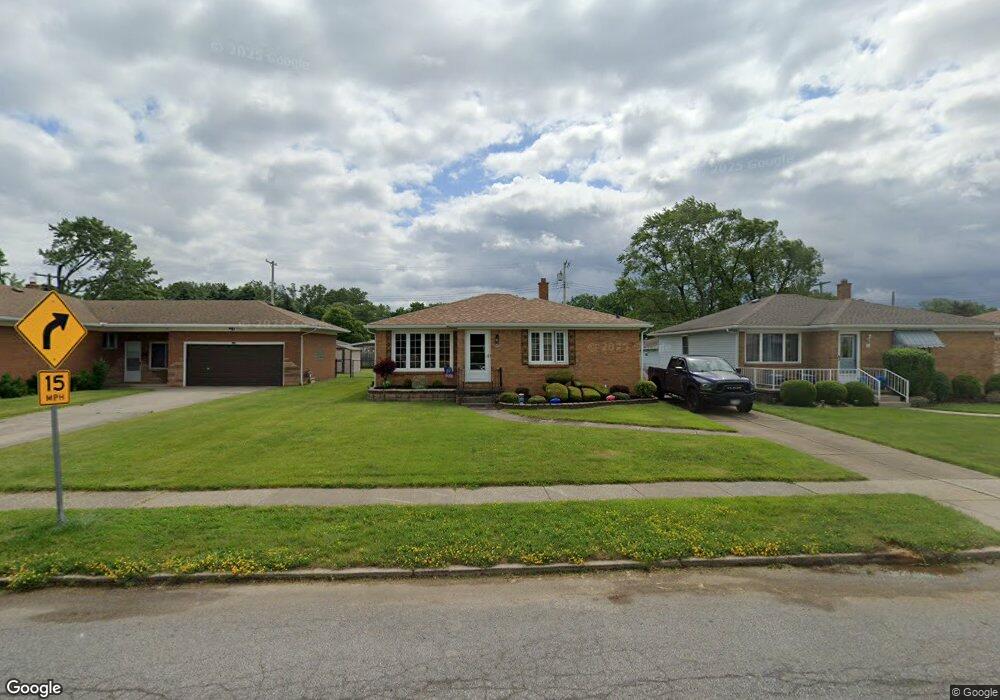
45 Ceil Dr Buffalo, NY 14227
South Cheektowaga NeighborhoodEstimated Value: $232,053 - $277,000
3
Beds
1
Bath
1,181
Sq Ft
$216/Sq Ft
Est. Value
About This Home
This home is located at 45 Ceil Dr, Buffalo, NY 14227 and is currently estimated at $255,513, approximately $216 per square foot. 45 Ceil Dr is a home located in Erie County with nearby schools including Theodore Roosevelt School, Woodrow Wilson Elementary School, and John F Kennedy Middle School.
Ownership History
Date
Name
Owned For
Owner Type
Purchase Details
Closed on
Aug 16, 2007
Sold by
Bogdan Kelly and Higley Kelly
Bought by
Higley Richard J
Current Estimated Value
Purchase Details
Closed on
Aug 25, 2003
Sold by
Beller Josephine M
Bought by
Higley Richard
Home Financials for this Owner
Home Financials are based on the most recent Mortgage that was taken out on this home.
Original Mortgage
$94,155
Interest Rate
5.52%
Mortgage Type
FHA
Purchase Details
Closed on
Dec 6, 2000
Sold by
Hud
Bought by
Belcer Josephine M
Purchase Details
Closed on
Mar 22, 2000
Sold by
Bank United
Bought by
Hud
Purchase Details
Closed on
Feb 15, 2000
Sold by
Arbogast Robert E and Arbogast Andra E
Bought by
Bank United and Bank United Of Texas Fsb
Purchase Details
Closed on
Aug 30, 1996
Sold by
Rummell Edward S and Rummell Paul D
Bought by
Arbogast Robert E and Arbogast Andra E
Create a Home Valuation Report for This Property
The Home Valuation Report is an in-depth analysis detailing your home's value as well as a comparison with similar homes in the area
Home Values in the Area
Average Home Value in this Area
Purchase History
| Date | Buyer | Sale Price | Title Company |
|---|---|---|---|
| Higley Richard J | -- | None Available | |
| Higley Richard | $94,900 | Michael Benson | |
| Belcer Josephine M | $45,455 | -- | |
| Hud | -- | -- | |
| Bank United | $102,000 | -- | |
| Arbogast Robert E | $72,000 | -- |
Source: Public Records
Mortgage History
| Date | Status | Borrower | Loan Amount |
|---|---|---|---|
| Previous Owner | Higley Richard | $94,155 |
Source: Public Records
Tax History
| Year | Tax Paid | Tax Assessment Tax Assessment Total Assessment is a certain percentage of the fair market value that is determined by local assessors to be the total taxable value of land and additions on the property. | Land | Improvement |
|---|---|---|---|---|
| 2024 | $6,431 | $173,000 | $18,000 | $155,000 |
| 2023 | $6,157 | $173,000 | $18,000 | $155,000 |
| 2022 | $6,069 | $173,000 | $18,000 | $155,000 |
| 2021 | $6,009 | $150,700 | $18,000 | $132,700 |
| 2020 | $5,133 | $103,000 | $13,400 | $89,600 |
| 2019 | $4,784 | $103,000 | $13,400 | $89,600 |
| 2018 | $4,859 | $103,000 | $13,400 | $89,600 |
| 2017 | $2,429 | $103,000 | $13,400 | $89,600 |
| 2016 | $4,749 | $103,000 | $13,400 | $89,600 |
| 2015 | -- | $103,000 | $13,400 | $89,600 |
| 2014 | -- | $95,000 | $13,400 | $81,600 |
Source: Public Records
Map
Nearby Homes
- 30 Jane Dr
- 12 Brookfield Ln Unit 6
- 27 Edmund St
- 79 Raymond Ave
- 104 Starlite Ave
- 83 Patricia Ln
- 60 Constance Ln
- 2445 William St
- 20 Fairoaks Ln
- 104 Iroquois Ave
- 57 Lorraine Place
- 192 Cass Ave
- 156 Cass Ave
- 255 Crisfield Ave
- 73 Fairoaks Ln
- 75 Fairoaks Ln
- 40 Marie Ave
- 52 Rushford Hollow Dr
- 54 Creekside Dr
- 110 Hedley St
Your Personal Tour Guide
Ask me questions while you tour the home.