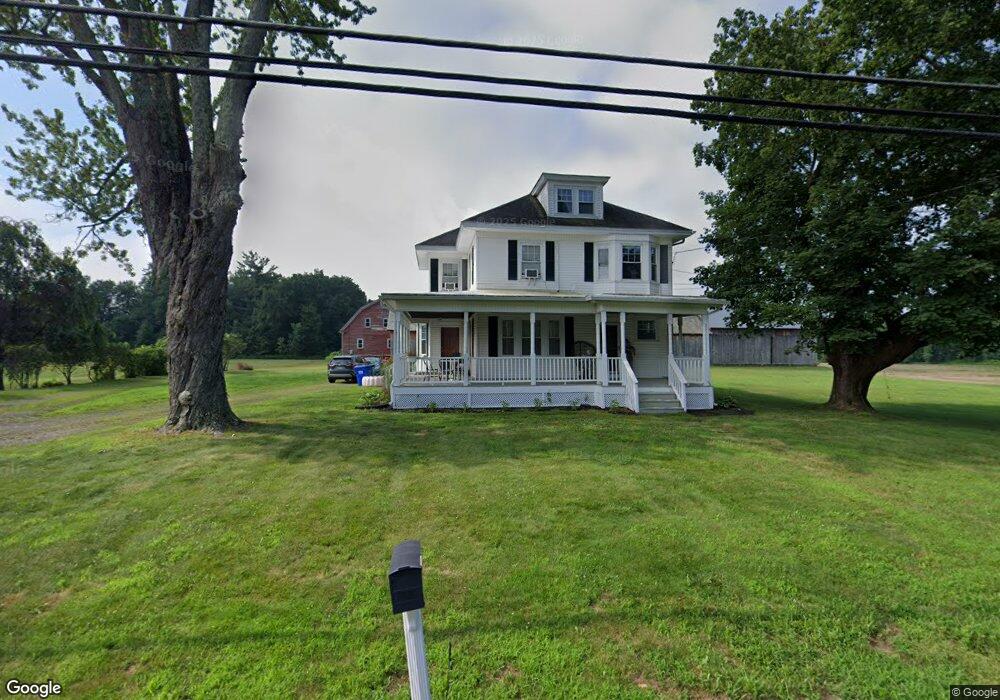
45 Chestnut St Hatfield, MA 01038
Estimated Value: $668,000 - $970,000
4
Beds
1
Bath
2,960
Sq Ft
$276/Sq Ft
Est. Value
About This Home
This home is located at 45 Chestnut St, Hatfield, MA 01038 and is currently estimated at $816,218, approximately $275 per square foot. 45 Chestnut St is a home located in Hampshire County with nearby schools including Hatfield Elementary School and Smith Academy.
Ownership History
Date
Name
Owned For
Owner Type
Purchase Details
Closed on
Jan 8, 1998
Sold by
Boyle Ft and Boyle David Flynn
Bought by
Szawlowski Rlty Inc
Current Estimated Value
Home Financials for this Owner
Home Financials are based on the most recent Mortgage that was taken out on this home.
Original Mortgage
$328,350
Outstanding Balance
$56,734
Interest Rate
7.09%
Mortgage Type
Purchase Money Mortgage
Estimated Equity
$759,484
Create a Home Valuation Report for This Property
The Home Valuation Report is an in-depth analysis detailing your home's value as well as a comparison with similar homes in the area
Home Values in the Area
Average Home Value in this Area
Purchase History
| Date | Buyer | Sale Price | Title Company |
|---|---|---|---|
| Szawlowski Rlty Inc | $475,000 | -- |
Source: Public Records
Mortgage History
| Date | Status | Borrower | Loan Amount |
|---|---|---|---|
| Open | Szawlowski Rlty Inc | $328,350 |
Source: Public Records
Tax History
| Year | Tax Paid | Tax Assessment Tax Assessment Total Assessment is a certain percentage of the fair market value that is determined by local assessors to be the total taxable value of land and additions on the property. | Land | Improvement |
|---|---|---|---|---|
| 2025 | $9,846 | $711,400 | $274,000 | $437,400 |
| 2024 | $9,645 | $630,000 | $244,100 | $385,900 |
| 2023 | $8,052 | $597,300 | $227,600 | $369,700 |
| 2022 | $7,745 | $566,600 | $220,900 | $345,700 |
| 2021 | $7,743 | $545,700 | $209,600 | $336,100 |
| 2020 | $7,383 | $545,700 | $209,600 | $336,100 |
| 2019 | $7,363 | $530,100 | $227,400 | $302,700 |
| 2018 | $7,070 | $520,600 | $227,400 | $293,200 |
| 2017 | $6,787 | $513,400 | $227,400 | $286,000 |
| 2016 | $6,735 | $511,000 | $227,400 | $283,600 |
| 2015 | $6,427 | $488,000 | $212,100 | $275,900 |
| 2014 | $6,183 | $488,000 | $212,100 | $275,900 |
Source: Public Records
Map
Nearby Homes
- 62 Bridge St
- 18 Elm St
- 58 Main St Unit 4
- 58 Main St Unit 3
- 0 Straits Rd
- 12 Dwight St
- 0 Pantry Rd Unit 73430264
- 11 West St
- 0 N Branch Rd
- 182 Old Stage Rd
- 32 Stonewall Dr
- 151 Pantry Rd
- 26 Russell St Unit A-B
- 80 Damon Rd Unit 5104
- 80 Damon Rd Unit 4302
- 88 Pines Edge Dr Unit 88
- 289 Hatfield St
- 35 Hubbard Ave
- 83 Bay Rd
- 22 Woodbine Ave
- 50 Chestnut St
- 39 Chestnut St
- 37 Chestnut St
- 40 Chestnut St
- 56 Chestnut St
- 55 Chestnut St
- 36 Chestnut St
- 35 Chestnut St
- 62 Chestnut St
- 71 Prospect St
- 57 Chestnut St
- 34 Chestnut St
- 65 Prospect St
- 65 Prospect St Unit 1
- 66 Chestnut St
- 80 Prospect St
- 74 Prospect St
- 63 Chestnut St
- 85 Prospect St
- 59 Prospect St
Your Personal Tour Guide
Ask me questions while you tour the home.