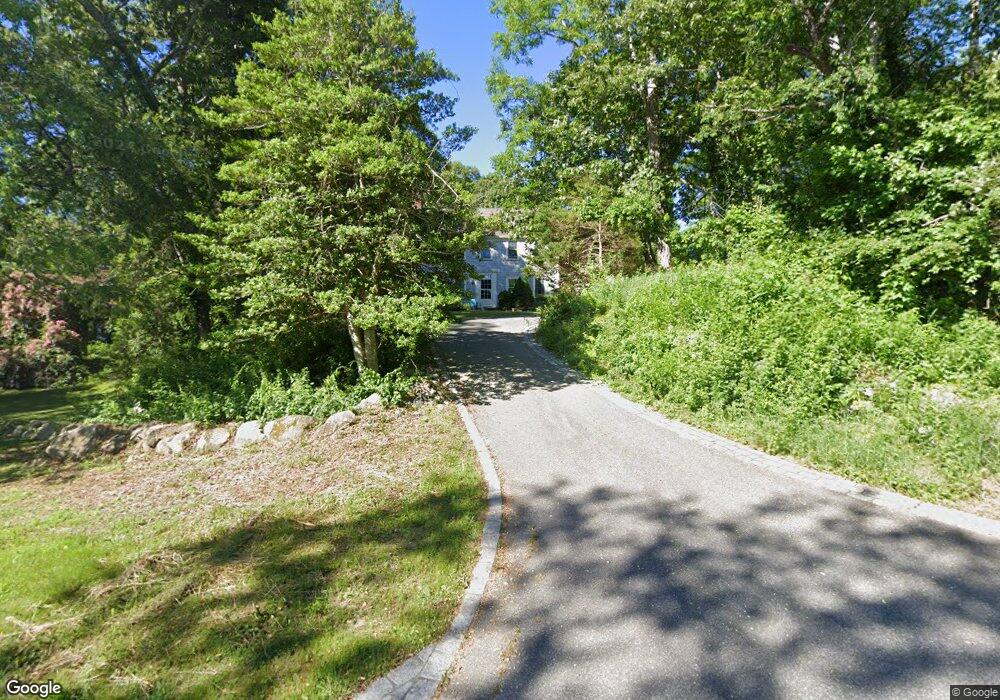
45 Church St West Barnstable, MA 02668
West Barnstable NeighborhoodEstimated Value: $737,000 - $910,000
3
Beds
2
Baths
1,861
Sq Ft
$438/Sq Ft
Est. Value
About This Home
This home is located at 45 Church St, West Barnstable, MA 02668 and is currently estimated at $814,597, approximately $437 per square foot. 45 Church St is a home located in Barnstable County with nearby schools including West Barnstable Elementary School, Barnstable United Elementary School, and Barnstable Intermediate School.
Ownership History
Date
Name
Owned For
Owner Type
Purchase Details
Closed on
Sep 5, 1996
Sold by
Nickulas Donald W
Bought by
Sisson Paul A and Sisson Janet A
Current Estimated Value
Purchase Details
Closed on
Apr 1, 1996
Sold by
Eastern Sb
Bought by
Nickulas Donald W
Purchase Details
Closed on
Dec 13, 1995
Sold by
Gp Corp
Bought by
Eastern Sb
Create a Home Valuation Report for This Property
The Home Valuation Report is an in-depth analysis detailing your home's value as well as a comparison with similar homes in the area
Home Values in the Area
Average Home Value in this Area
Purchase History
| Date | Buyer | Sale Price | Title Company |
|---|---|---|---|
| Sisson Paul A | $175,000 | -- | |
| Nickulas Donald W | $35,000 | -- | |
| Eastern Sb | $76,824 | -- |
Source: Public Records
Mortgage History
| Date | Status | Borrower | Loan Amount |
|---|---|---|---|
| Open | Eastern Sb | $150,000 | |
| Closed | Eastern Sb | $150,000 | |
| Closed | Eastern Sb | $15,000 |
Source: Public Records
Tax History Compared to Growth
Tax History
| Year | Tax Paid | Tax Assessment Tax Assessment Total Assessment is a certain percentage of the fair market value that is determined by local assessors to be the total taxable value of land and additions on the property. | Land | Improvement |
|---|---|---|---|---|
| 2025 | $6,123 | $655,600 | $176,600 | $479,000 |
| 2024 | $5,113 | $595,900 | $176,600 | $419,300 |
| 2023 | $5,283 | $579,900 | $160,600 | $419,300 |
| 2022 | $5,306 | $477,600 | $119,100 | $358,500 |
| 2021 | $5,088 | $434,100 | $119,100 | $315,000 |
| 2020 | $5,092 | $420,100 | $126,900 | $293,200 |
| 2019 | $4,740 | $386,000 | $126,900 | $259,100 |
| 2018 | $4,494 | $362,700 | $133,500 | $229,200 |
| 2017 | $4,066 | $332,200 | $133,500 | $198,700 |
| 2016 | $4,026 | $335,800 | $137,100 | $198,700 |
| 2015 | $3,711 | $310,300 | $127,400 | $182,900 |
Source: Public Records
Map
Nearby Homes
- 250 The Plains Rd
- 2400 Meetinghouse Way
- 50 Currycomb Cir
- 282 Parker Rd
- 780 Main St
- 80 Saddler Ln
- 74 Saddler Ln
- 510 Cedar St
- 515 Cedar St
- 88 Joe Thompson Rd
- 40 Appaloosa Way
- 75 Old Toll Rd
- 350 Plum St
- 350 & 360 Plum St
- 718 Cedar St
- 50 Wayside Ln
- 1044 Old Falmouth Rd
- 1028 Old Falmouth Rd
- 62 Three Ponds Dr
- 158 Lakeside Dr
- 59 Church St
- 159 The Plains Rd N
- 29 Church St
- 72 Church St
- 72 Church St
- 47 The Plains Rd N
- 40 Church St
- 20 Church St
- 21 The Plains Rd N
- 2049 Meetinghouse Way
- 50 Church St
- 4 Cedar St
- 122 Church St
- 2 Sandy St
- 15 Cedar St
- 106 Church St
- 2320/2346 Meetinghouse Way
- 160 Church St
- 20 Cedar St
- 2130 Meetinghouse Way