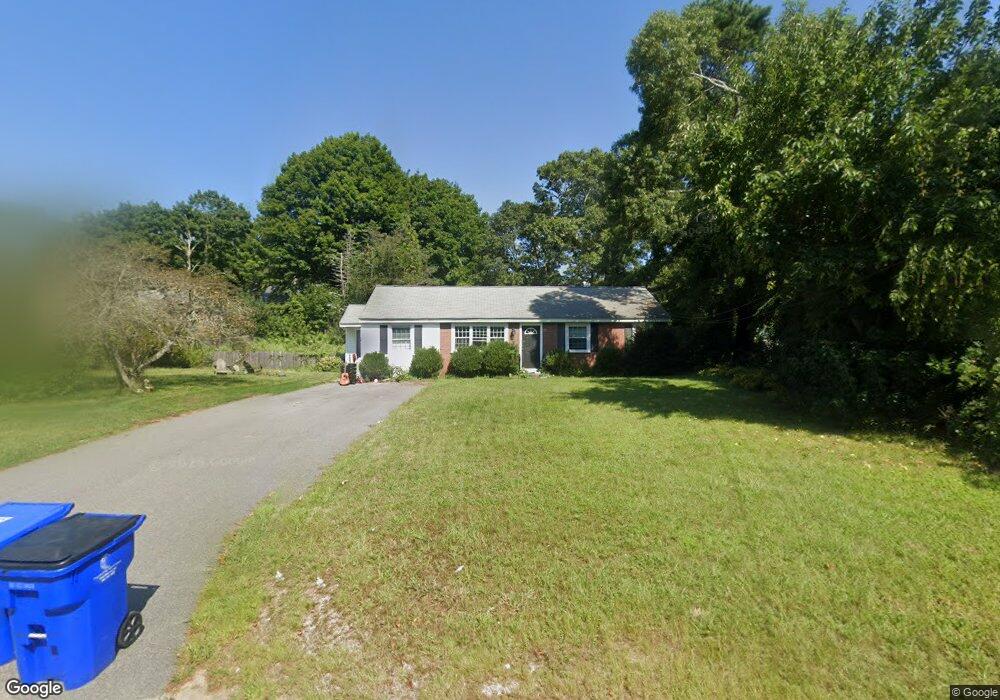
45 Clay Pond Rd Bourne, MA 2532
Monument Beach NeighborhoodEstimated Value: $502,626 - $568,000
3
Beds
2
Baths
1,524
Sq Ft
$358/Sq Ft
Est. Value
About This Home
This home is located at 45 Clay Pond Rd, Bourne, MA 2532 and is currently estimated at $545,157, approximately $357 per square foot. 45 Clay Pond Rd is a home located in Barnstable County with nearby schools including Bourne High School, Cadence Academy Preschool - Bourne, and St Margaret Regional School.
Ownership History
Date
Name
Owned For
Owner Type
Purchase Details
Closed on
Nov 13, 2013
Sold by
Kirk Joyce C
Bought by
45 Clay Pond Road Rt and Tarr
Current Estimated Value
Purchase Details
Closed on
Nov 22, 2010
Sold by
Kirk William J
Bought by
Kirk Joyce C
Purchase Details
Closed on
Aug 28, 2008
Sold by
May Robins E and May Robins E
Bought by
Kirk William J
Purchase Details
Closed on
May 9, 2008
Sold by
May Eugenia H and May Robins E
Bought by
May Robins E
Create a Home Valuation Report for This Property
The Home Valuation Report is an in-depth analysis detailing your home's value as well as a comparison with similar homes in the area
Home Values in the Area
Average Home Value in this Area
Purchase History
| Date | Buyer | Sale Price | Title Company |
|---|---|---|---|
| 45 Clay Pond Road Rt | -- | -- | |
| 45 Clay Pond Road Rt | -- | -- | |
| Kirk Joyce C | $200,000 | -- | |
| Kirk Joyce C | $200,000 | -- | |
| Kirk William J | $245,000 | -- | |
| Kirk William J | $245,000 | -- | |
| May Robins E | -- | -- | |
| May Robins E | -- | -- | |
| May Robins E | -- | -- |
Source: Public Records
Tax History
| Year | Tax Paid | Tax Assessment Tax Assessment Total Assessment is a certain percentage of the fair market value that is determined by local assessors to be the total taxable value of land and additions on the property. | Land | Improvement |
|---|---|---|---|---|
| 2025 | $3,408 | $436,400 | $177,800 | $258,600 |
| 2024 | $3,333 | $415,600 | $169,300 | $246,300 |
| 2023 | $3,241 | $367,900 | $149,900 | $218,000 |
| 2022 | $3,084 | $305,600 | $132,600 | $173,000 |
| 2021 | $5,485 | $278,200 | $120,700 | $157,500 |
| 2020 | $2,902 | $270,200 | $119,500 | $150,700 |
| 2019 | $5,352 | $261,700 | $119,500 | $142,200 |
| 2018 | $5,528 | $242,400 | $113,900 | $128,500 |
| 2017 | $5,362 | $234,300 | $107,100 | $127,200 |
| 2016 | $2,320 | $228,300 | $107,100 | $121,200 |
| 2015 | $2,186 | $217,100 | $95,900 | $121,200 |
Source: Public Records
Map
Nearby Homes
- 566 Shore Rd
- 203 County Rd
- 16 Amberwood Ct
- 20 Colony Ave
- 4 Harbor Hill Dr
- 12 Turnberry Rd Unit 12
- 13 Laurel Hill Ct
- 4 Hollyhock Knoll Ct Unit 4
- 4 Hollyhock Knoll Ct Unit 4
- 5 Sea Knoll Ct
- 5 Zoli Ln
- 14 Navajo Rd
- 709 County Rd
- 35 Benedict Rd
- 3 1st St
- 254 Barlows Landing Rd
- 3 4th Ave
- 7 4th Ave
- 44 Cotuit Rd
- 16 Michael Rd
Your Personal Tour Guide
Ask me questions while you tour the home.