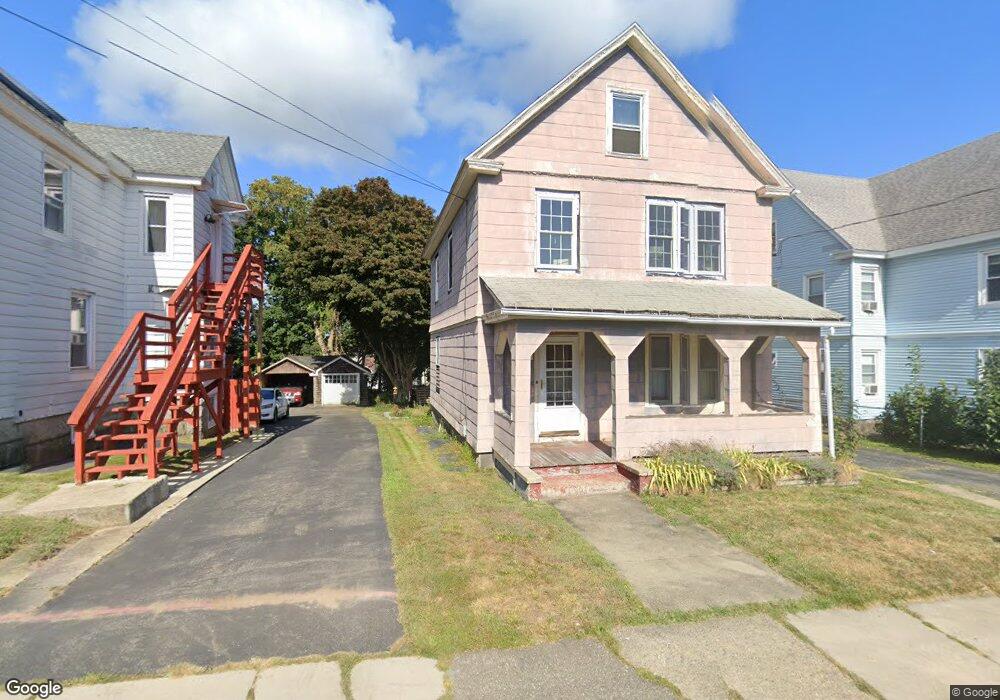
45 Colman St New London, CT 06320
Jefferson NeighborhoodEstimated Value: $227,000 - $311,000
3
Beds
1
Bath
1,436
Sq Ft
$180/Sq Ft
Est. Value
About This Home
This home is located at 45 Colman St, New London, CT 06320 and is currently estimated at $258,515, approximately $180 per square foot. 45 Colman St is a home located in New London County with nearby schools including Harbor Elementary School, Bennie Dover Jackson Middle School, and New London High School.
Ownership History
Date
Name
Owned For
Owner Type
Purchase Details
Closed on
Oct 29, 2004
Sold by
Biggs Richard and Biggs Ruth
Bought by
Hathaway Matthew
Current Estimated Value
Home Financials for this Owner
Home Financials are based on the most recent Mortgage that was taken out on this home.
Original Mortgage
$70,000
Outstanding Balance
$34,839
Interest Rate
5.74%
Estimated Equity
$223,676
Purchase Details
Closed on
Aug 6, 1992
Sold by
Barry Mary T Est
Bought by
Biggs Richard Scott and Biggs Ruth
Home Financials for this Owner
Home Financials are based on the most recent Mortgage that was taken out on this home.
Original Mortgage
$61,500
Interest Rate
8%
Mortgage Type
Unknown
Create a Home Valuation Report for This Property
The Home Valuation Report is an in-depth analysis detailing your home's value as well as a comparison with similar homes in the area
Home Values in the Area
Average Home Value in this Area
Purchase History
| Date | Buyer | Sale Price | Title Company |
|---|---|---|---|
| Hathaway Matthew | $70,000 | -- | |
| Hathaway Matthew | $70,000 | -- | |
| Biggs Richard Scott | $61,500 | -- | |
| Biggs Richard Scott | $61,500 | -- |
Source: Public Records
Mortgage History
| Date | Status | Borrower | Loan Amount |
|---|---|---|---|
| Open | Biggs Richard Scott | $70,000 | |
| Closed | Biggs Richard Scott | $70,000 | |
| Previous Owner | Biggs Richard Scott | $61,500 |
Source: Public Records
Tax History Compared to Growth
Tax History
| Year | Tax Paid | Tax Assessment Tax Assessment Total Assessment is a certain percentage of the fair market value that is determined by local assessors to be the total taxable value of land and additions on the property. | Land | Improvement |
|---|---|---|---|---|
| 2025 | $3,308 | $121,600 | $31,400 | $90,200 |
| 2024 | $3,344 | $121,600 | $31,400 | $90,200 |
| 2023 | $2,688 | $72,170 | $25,130 | $47,040 |
| 2022 | $2,693 | $72,170 | $25,130 | $47,040 |
| 2021 | $2,739 | $72,170 | $25,130 | $47,040 |
| 2020 | $2,756 | $72,170 | $25,130 | $47,040 |
| 2019 | $2,880 | $72,170 | $25,130 | $47,040 |
| 2018 | $3,368 | $77,000 | $25,130 | $51,870 |
| 2017 | $3,408 | $77,000 | $25,130 | $51,870 |
| 2016 | $3,115 | $77,000 | $25,130 | $51,870 |
| 2015 | $3,041 | $77,000 | $25,130 | $51,870 |
| 2014 | $2,639 | $77,000 | $25,130 | $51,870 |
Source: Public Records
Map
Nearby Homes
- 77 Colman St
- 835 Bank St
- 26 Jefferson Ave
- 49 Belden St
- 2 Faye St
- 55 Connecticut Ave
- 59 Connecticut Ave
- 18 W Pleasant St
- 32 Moore Ave
- 38 Mountain Ave
- 142 Montauk Ave
- 152 Blydenburg Ave
- 35 Pine St
- 2 Coit St Unit 1
- 24 Pine St
- 9 Brewer St Unit 3
- 9 Brewer St Unit 1
- 9 Brewer St Unit 2
- 9 Brewer St
- 12 Pine St