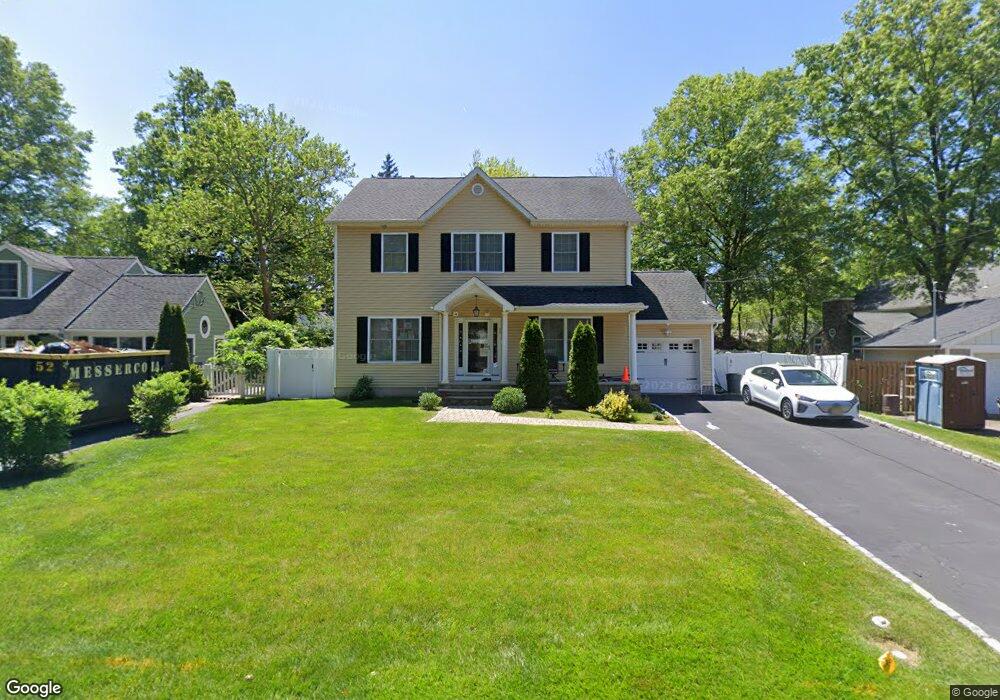
45 Crescent Dr New Providence, NJ 07974
Estimated Value: $741,000 - $816,676
--
Bed
--
Bath
1,942
Sq Ft
$398/Sq Ft
Est. Value
About This Home
This home is located at 45 Crescent Dr, New Providence, NJ 07974 and is currently estimated at $772,419, approximately $397 per square foot. 45 Crescent Dr is a home located in Union County with nearby schools including New Providence High School and The Academy of Our Lady of Peace.
Ownership History
Date
Name
Owned For
Owner Type
Purchase Details
Closed on
Oct 10, 2003
Sold by
Lumby Jeffrey
Bought by
Flanagan Michael and Flanagan Jennifer
Current Estimated Value
Home Financials for this Owner
Home Financials are based on the most recent Mortgage that was taken out on this home.
Original Mortgage
$246,400
Outstanding Balance
$113,405
Interest Rate
6.01%
Estimated Equity
$659,014
Purchase Details
Closed on
Aug 19, 1999
Sold by
Federal Home Loan Mortgage Corporation
Bought by
Lumby Jeffrey S
Home Financials for this Owner
Home Financials are based on the most recent Mortgage that was taken out on this home.
Original Mortgage
$161,600
Interest Rate
7.53%
Mortgage Type
FHA
Purchase Details
Closed on
Feb 9, 1999
Sold by
Porash Arthur
Bought by
Federal Home Loan Mortgage Corporation
Create a Home Valuation Report for This Property
The Home Valuation Report is an in-depth analysis detailing your home's value as well as a comparison with similar homes in the area
Home Values in the Area
Average Home Value in this Area
Purchase History
| Date | Buyer | Sale Price | Title Company |
|---|---|---|---|
| Flanagan Michael | $308,000 | -- | |
| Lumby Jeffrey S | $161,700 | -- | |
| Federal Home Loan Mortgage Corporation | -- | -- |
Source: Public Records
Mortgage History
| Date | Status | Borrower | Loan Amount |
|---|---|---|---|
| Open | Flanagan Michael | $246,400 | |
| Previous Owner | Lumby Jeffrey S | $161,600 |
Source: Public Records
Tax History Compared to Growth
Tax History
| Year | Tax Paid | Tax Assessment Tax Assessment Total Assessment is a certain percentage of the fair market value that is determined by local assessors to be the total taxable value of land and additions on the property. | Land | Improvement |
|---|---|---|---|---|
| 2025 | $11,676 | $226,200 | $106,500 | $119,700 |
| 2024 | $11,326 | $226,200 | $106,500 | $119,700 |
| 2023 | $11,326 | $226,200 | $106,500 | $119,700 |
| 2022 | $11,170 | $226,200 | $106,500 | $119,700 |
| 2021 | $11,088 | $226,200 | $106,500 | $119,700 |
| 2020 | $11,084 | $226,200 | $106,500 | $119,700 |
| 2019 | $11,016 | $226,200 | $106,500 | $119,700 |
| 2018 | $10,959 | $226,200 | $106,500 | $119,700 |
| 2017 | $10,781 | $226,200 | $106,500 | $119,700 |
| 2016 | $10,629 | $226,200 | $106,500 | $119,700 |
| 2015 | $10,482 | $226,200 | $106,500 | $119,700 |
| 2014 | $10,324 | $226,200 | $106,500 | $119,700 |
Source: Public Records
Map
Nearby Homes
- 100 Commonwealth Ave
- 29 Walton Ave
- 197 Elkwood Ave
- 32 Charnwood Rd
- 5 Kincaid Ln
- 1200 Springfield Ave Unit 1B
- 17B Heritage Dr Unit B
- 283 Riveredge Dr
- 14 Holmes Oval
- 21G Heritage Dr Unit G
- 2F Terrace Dr Unit F
- 175 Terrace Dr
- 54 Badgley Dr
- 146 Riveredge Dr
- 45 Runnymede Rd
- 131 van Houton Ave
- 32 Marion Ave
- 36 Terrace Rd
- 16 Terrace Rd
- 20 High St