B
Seller's Agent in 2013
Bernice Salzberg
Salzberg Real Estate
(401) 762-6430
1 in this area
5 Total Sales
Estimated Value: $577,000 - $660,000
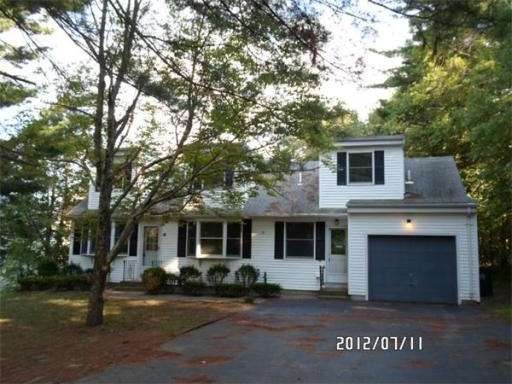
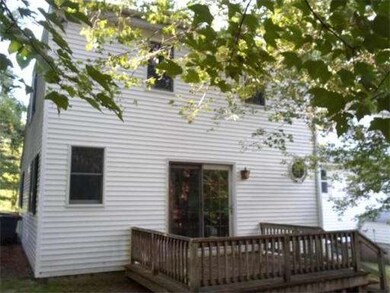
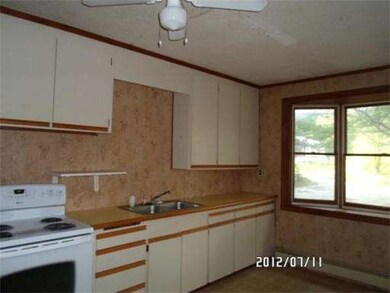
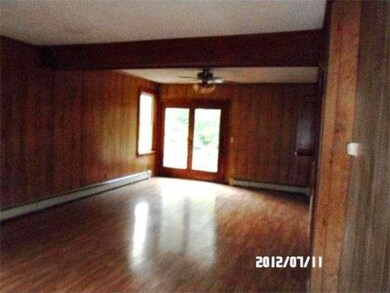
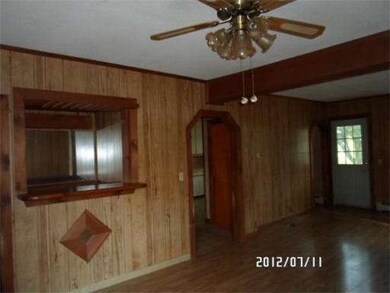
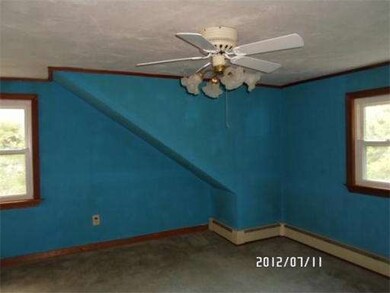
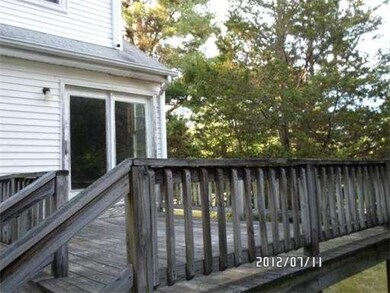
Vinyl sided cape, 3 Bedrooms, plus townhouse style in-law with oversized bedroom, 2.5 baths, first level landry, front to back living room, large kitchens, garage, plenty of off street parking, engineering for septic completed, This is a HomePath Property. Purchase with as little as 3% downpayment.
Last Agent to Sell the Property
Salzberg Real Estate License #745530110 Listed on: 09/05/2012
Home Type
Single Family
Year Built
1949
Lot Details
0
| Date | Buyer | Sale Price | Title Company |
|---|---|---|---|
| Gamble Tyson M | $175,020 | -- |
| Date | Status | Borrower | Loan Amount |
|---|---|---|---|
| Open | Gamble Tyson M | $204,552 |
| Date | Event | Price | List to Sale | Price per Sq Ft |
|---|---|---|---|---|
| 04/05/2013 04/05/13 | Sold | $175,020 | +0.1% | $75 / Sq Ft |
| 03/01/2013 03/01/13 | Pending | -- | -- | -- |
| 02/28/2013 02/28/13 | For Sale | $174,900 | 0.0% | $75 / Sq Ft |
| 11/19/2012 11/19/12 | Pending | -- | -- | -- |
| 11/07/2012 11/07/12 | Price Changed | $174,900 | -6.7% | $75 / Sq Ft |
| 11/03/2012 11/03/12 | For Sale | $187,500 | 0.0% | $80 / Sq Ft |
| 09/13/2012 09/13/12 | Pending | -- | -- | -- |
| 09/05/2012 09/05/12 | For Sale | $187,500 | -- | $80 / Sq Ft |
| Year | Tax Paid | Tax Assessment Tax Assessment Total Assessment is a certain percentage of the fair market value that is determined by local assessors to be the total taxable value of land and additions on the property. | Land | Improvement |
|---|---|---|---|---|
| 2025 | $5,240 | $417,200 | $170,400 | $246,800 |
| 2024 | $4,994 | $388,300 | $155,600 | $232,700 |
| 2023 | $4,814 | $368,900 | $148,200 | $220,700 |
| 2022 | $4,656 | $330,700 | $123,600 | $207,100 |
| 2021 | $4,520 | $313,700 | $123,600 | $190,100 |
| 2020 | $4,412 | $310,300 | $123,600 | $186,700 |
| 2019 | $4,333 | $304,900 | $123,600 | $181,300 |
| 2018 | $4,134 | $286,900 | $118,800 | $168,100 |
| 2017 | $4,055 | $282,800 | $118,800 | $164,000 |
| 2016 | $3,845 | $269,100 | $116,800 | $152,300 |
| 2015 | $3,692 | $259,100 | $112,300 | $146,800 |
| 2014 | $3,718 | $253,600 | $109,800 | $143,800 |
B
Seller's Agent in 2013
Bernice Salzberg
Salzberg Real Estate
(401) 762-6430
1 in this area
5 Total Sales

Buyer's Agent in 2013
Eric Buliung
Laer Realty
(508) 314-4047
21 Total Sales
Source: MLS Property Information Network (MLS PIN)
MLS Number: 71430589
APN: BELL-000072-000008
Disclaimer: Certain information contained herein is derived from information provided by parties other than Homes.com. All information provided is deemed reliable, but is not guaranteed to be accurate and should be independently verified.
![]() The property listing data and information, or the Images, set forth herein were provided to MLS Property Information Network, Inc. from third party sources, including sellers, lessors and public records, and were compiled by MLS Property Information Network, Inc. The property listing data and information, and the Images, are for the personal, non-commercial use of consumers having a good faith interest in purchasing or leasing listed properties of the type displayed to them and may not be used for any purpose other than to identify prospective properties which such consumers may have a good faith interest in purchasing or leasing. MLS Property Information Network, Inc. and its subscribers disclaim any and all representations and warranties as to the accuracy of the property listing data and information, or as to the accuracy of any of the Images, set forth herein.
The property listing data and information, or the Images, set forth herein were provided to MLS Property Information Network, Inc. from third party sources, including sellers, lessors and public records, and were compiled by MLS Property Information Network, Inc. The property listing data and information, and the Images, are for the personal, non-commercial use of consumers having a good faith interest in purchasing or leasing listed properties of the type displayed to them and may not be used for any purpose other than to identify prospective properties which such consumers may have a good faith interest in purchasing or leasing. MLS Property Information Network, Inc. and its subscribers disclaim any and all representations and warranties as to the accuracy of the property listing data and information, or as to the accuracy of any of the Images, set forth herein.