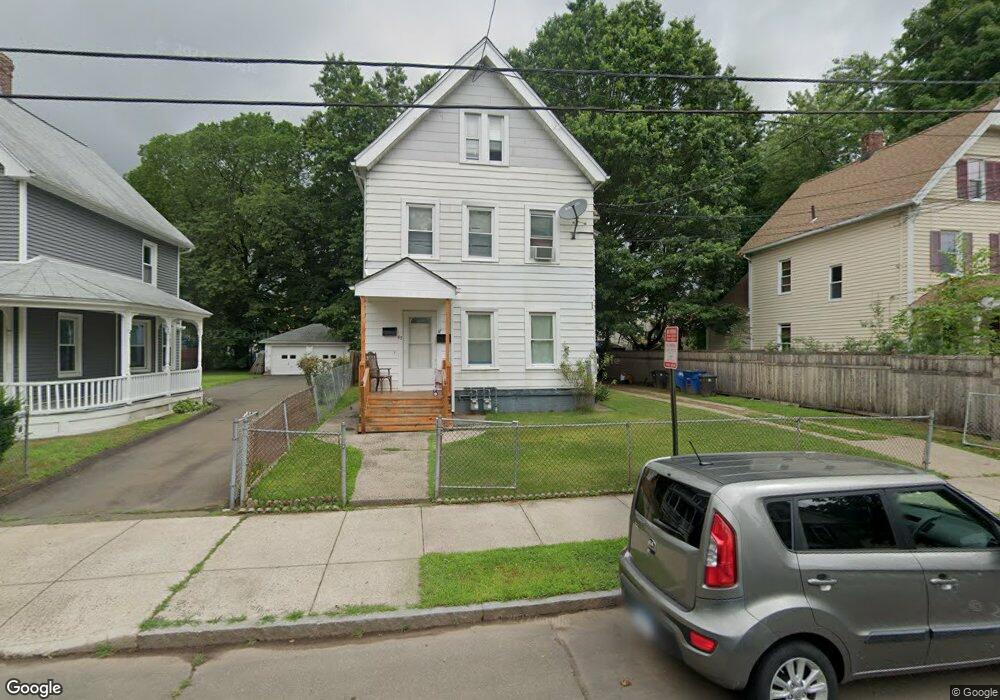
45 Dorman St New Haven, CT 06511
Newhallville NeighborhoodEstimated Value: $290,461 - $356,000
2
Beds
2
Baths
2,446
Sq Ft
$131/Sq Ft
Est. Value
About This Home
This home is located at 45 Dorman St, New Haven, CT 06511 and is currently estimated at $321,615, approximately $131 per square foot. 45 Dorman St is a home located in New Haven County with nearby schools including King/Robinson Magnet School, Highville Charter School, and The Foote School.
Ownership History
Date
Name
Owned For
Owner Type
Purchase Details
Closed on
Dec 1, 1992
Sold by
Adams Lynda F
Bought by
Joyner Rosa
Current Estimated Value
Home Financials for this Owner
Home Financials are based on the most recent Mortgage that was taken out on this home.
Original Mortgage
$89,600
Interest Rate
8.06%
Mortgage Type
Unknown
Create a Home Valuation Report for This Property
The Home Valuation Report is an in-depth analysis detailing your home's value as well as a comparison with similar homes in the area
Home Values in the Area
Average Home Value in this Area
Purchase History
| Date | Buyer | Sale Price | Title Company |
|---|---|---|---|
| Joyner Rosa | $90,000 | -- |
Source: Public Records
Mortgage History
| Date | Status | Borrower | Loan Amount |
|---|---|---|---|
| Closed | Joyner Rosa | $89,600 | |
| Closed | Joyner Rosa | $7,100 |
Source: Public Records
Tax History Compared to Growth
Tax History
| Year | Tax Paid | Tax Assessment Tax Assessment Total Assessment is a certain percentage of the fair market value that is determined by local assessors to be the total taxable value of land and additions on the property. | Land | Improvement |
|---|---|---|---|---|
| 2025 | $5,585 | $141,750 | $33,740 | $108,010 |
| 2024 | $5,457 | $141,750 | $33,740 | $108,010 |
| 2023 | $5,273 | $141,750 | $33,740 | $108,010 |
| 2022 | $5,635 | $141,750 | $33,740 | $108,010 |
| 2021 | $3,621 | $82,530 | $27,020 | $55,510 |
| 2020 | $3,621 | $82,530 | $27,020 | $55,510 |
| 2019 | $3,547 | $82,530 | $27,020 | $55,510 |
| 2018 | $3,547 | $82,530 | $27,020 | $55,510 |
| 2017 | $3,192 | $82,530 | $27,020 | $55,510 |
| 2016 | $2,449 | $58,940 | $11,970 | $46,970 |
| 2015 | $2,449 | $58,940 | $11,970 | $46,970 |
| 2014 | $2,449 | $58,940 | $11,970 | $46,970 |
Source: Public Records
Map
Nearby Homes