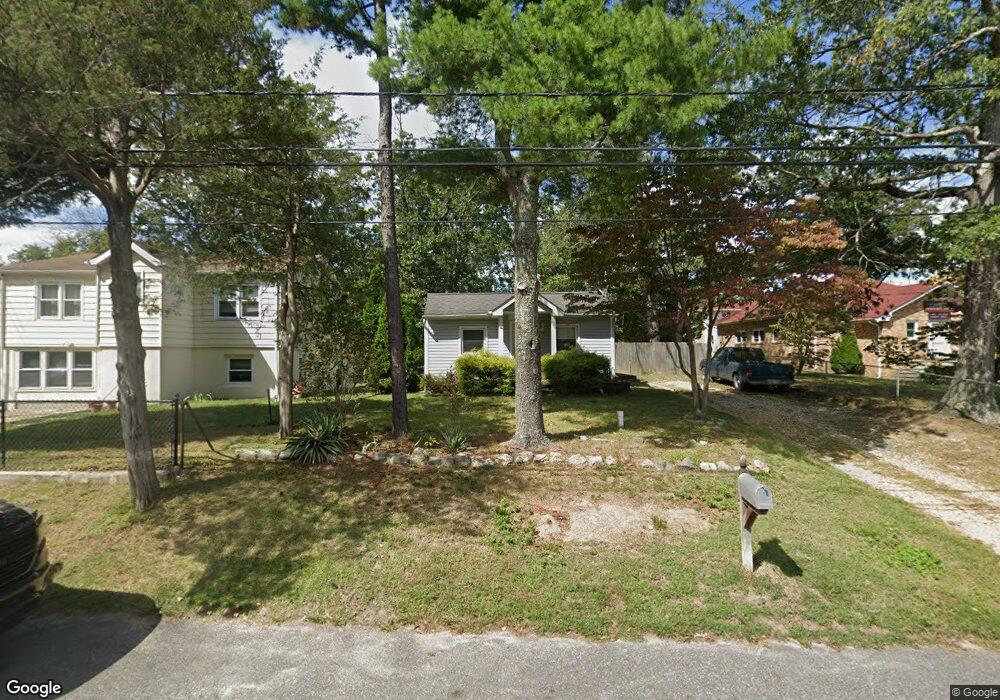
45 E 5th St Howell, NJ 07731
Adelphia NeighborhoodEstimated Value: $279,000 - $421,000
2
Beds
1
Bath
616
Sq Ft
$539/Sq Ft
Est. Value
About This Home
This home is located at 45 E 5th St, Howell, NJ 07731 and is currently estimated at $332,195, approximately $539 per square foot. 45 E 5th St is a home located in Monmouth County with nearby schools including Land O' Pines School, Newbury School, and Howell Middle School North.
Ownership History
Date
Name
Owned For
Owner Type
Purchase Details
Closed on
Sep 24, 2003
Sold by
Rievra Jose
Bought by
Hruska Michael
Current Estimated Value
Home Financials for this Owner
Home Financials are based on the most recent Mortgage that was taken out on this home.
Original Mortgage
$118,340
Interest Rate
5.98%
Purchase Details
Closed on
Sep 10, 1999
Sold by
Havens David
Bought by
Rivera Jose and Rivera Nancy
Home Financials for this Owner
Home Financials are based on the most recent Mortgage that was taken out on this home.
Original Mortgage
$45,500
Interest Rate
7.8%
Purchase Details
Closed on
Dec 23, 1996
Sold by
Fisher Thomas
Bought by
Havens David and Havens Jennifer
Home Financials for this Owner
Home Financials are based on the most recent Mortgage that was taken out on this home.
Original Mortgage
$59,000
Interest Rate
7.36%
Mortgage Type
FHA
Create a Home Valuation Report for This Property
The Home Valuation Report is an in-depth analysis detailing your home's value as well as a comparison with similar homes in the area
Home Values in the Area
Average Home Value in this Area
Purchase History
| Date | Buyer | Sale Price | Title Company |
|---|---|---|---|
| Hruska Michael | $122,000 | -- | |
| Rivera Jose | $65,000 | -- | |
| Havens David | $58,900 | -- |
Source: Public Records
Mortgage History
| Date | Status | Borrower | Loan Amount |
|---|---|---|---|
| Previous Owner | Hruska Michael | $118,340 | |
| Previous Owner | Rivera Jose | $45,500 | |
| Previous Owner | Havens David | $59,000 |
Source: Public Records
Tax History
| Year | Tax Paid | Tax Assessment Tax Assessment Total Assessment is a certain percentage of the fair market value that is determined by local assessors to be the total taxable value of land and additions on the property. | Land | Improvement |
|---|---|---|---|---|
| 2025 | $4,477 | $283,500 | $216,500 | $67,000 |
| 2024 | $4,016 | $252,200 | $186,500 | $65,700 |
Source: Public Records
Map
Nearby Homes
Your Personal Tour Guide
Ask me questions while you tour the home.