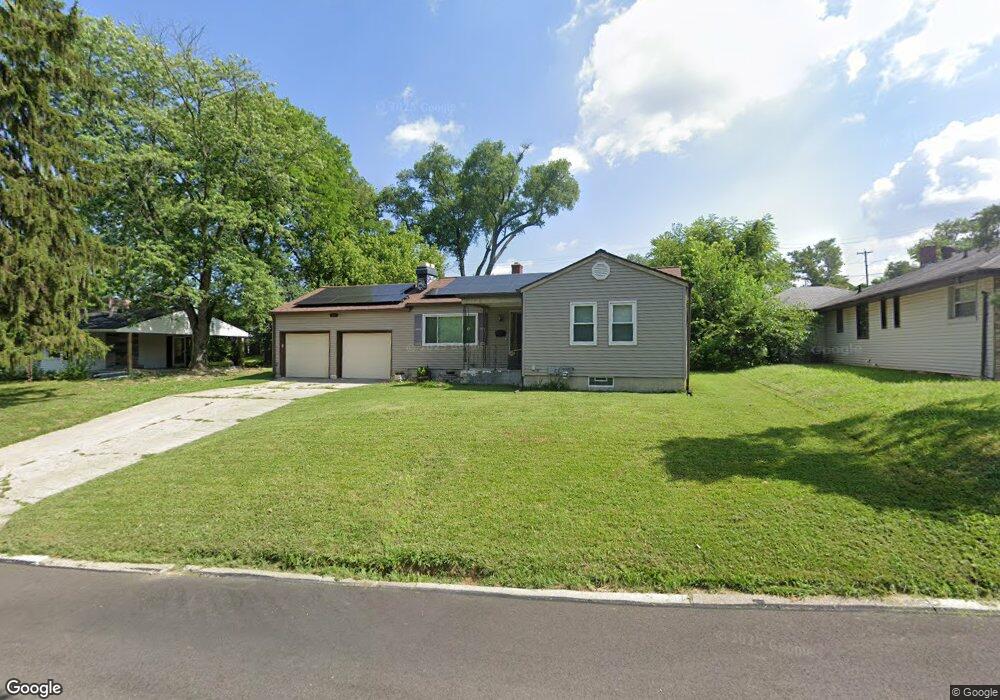
45 E Bryant Ave Franklin, OH 45005
Estimated Value: $219,000 - $239,000
3
Beds
1
Bath
1,356
Sq Ft
$168/Sq Ft
Est. Value
About This Home
This home is located at 45 E Bryant Ave, Franklin, OH 45005 and is currently estimated at $227,444, approximately $167 per square foot. 45 E Bryant Ave is a home located in Warren County with nearby schools including Franklin High School.
Ownership History
Date
Name
Owned For
Owner Type
Purchase Details
Closed on
May 28, 2010
Sold by
Wessinger Christopher and Wessinger Amber
Bought by
Travis Julian A and Schneider Consuelo A
Current Estimated Value
Home Financials for this Owner
Home Financials are based on the most recent Mortgage that was taken out on this home.
Original Mortgage
$108,538
Outstanding Balance
$74,607
Interest Rate
5.5%
Mortgage Type
FHA
Estimated Equity
$152,837
Purchase Details
Closed on
Mar 30, 2004
Sold by
Marshall Charles P and Marshall Kimberly R
Bought by
Wessinger Christopher and Wessinger Amber
Home Financials for this Owner
Home Financials are based on the most recent Mortgage that was taken out on this home.
Original Mortgage
$106,000
Interest Rate
5.65%
Mortgage Type
Purchase Money Mortgage
Purchase Details
Closed on
Dec 27, 1999
Sold by
Sticklelman Mary M
Bought by
Marshall Charles P Kimberly R
Home Financials for this Owner
Home Financials are based on the most recent Mortgage that was taken out on this home.
Original Mortgage
$99,949
Interest Rate
7.7%
Mortgage Type
FHA
Create a Home Valuation Report for This Property
The Home Valuation Report is an in-depth analysis detailing your home's value as well as a comparison with similar homes in the area
Home Values in the Area
Average Home Value in this Area
Purchase History
| Date | Buyer | Sale Price | Title Company |
|---|---|---|---|
| Travis Julian A | $110,000 | Hallmark Title Agency Inc | |
| Wessinger Christopher | $106,000 | -- | |
| Marshall Charles P Kimberly R | $100,000 | -- |
Source: Public Records
Mortgage History
| Date | Status | Borrower | Loan Amount |
|---|---|---|---|
| Open | Travis Julian A | $108,538 | |
| Previous Owner | Wessinger Christopher | $106,000 | |
| Previous Owner | Marshall Charles P Kimberly R | $99,949 |
Source: Public Records
Tax History
| Year | Tax Paid | Tax Assessment Tax Assessment Total Assessment is a certain percentage of the fair market value that is determined by local assessors to be the total taxable value of land and additions on the property. | Land | Improvement |
|---|---|---|---|---|
| 2025 | $2,799 | $59,460 | $17,500 | $41,960 |
| 2024 | $2,799 | $59,460 | $17,500 | $41,960 |
| 2023 | $2,515 | $47,939 | $10,762 | $37,177 |
| 2022 | $2,466 | $47,940 | $10,763 | $37,177 |
| 2021 | $2,338 | $47,940 | $10,763 | $37,177 |
| 2020 | $2,095 | $37,891 | $8,750 | $29,141 |
| 2019 | $1,906 | $37,891 | $8,750 | $29,141 |
| 2018 | $1,880 | $37,891 | $8,750 | $29,141 |
| 2017 | $1,796 | $32,613 | $7,648 | $24,966 |
| 2016 | $1,831 | $32,613 | $7,648 | $24,966 |
| 2015 | $1,831 | $32,613 | $7,648 | $24,966 |
| 2014 | $1,854 | $32,610 | $7,650 | $24,970 |
| 2013 | $1,592 | $37,320 | $8,750 | $28,570 |
Source: Public Records
Map
Nearby Homes
- 0 Victoria Dr Unit 942075
- 0 Victoria Dr Unit 1852824
- 228 Bridge St
- 212 Rossman Ct
- 33 Stadia Dr
- 5 S River St
- 551 E 2nd St
- 210 N Riley Blvd
- 657 E 2nd St
- 651 E 2nd St
- 202 E 2nd St
- 413 Spring Ave
- 520 Arlington Ave
- 205 Oxford Rd
- 410 Park Ave
- 605 Spring Ave
- 309 Oxford Rd
- 747 David Blvd
- 0 E 4th St
- 616 Lake Ave
- 405 Victoria Dr
- 1 Arlington Dr
- 415 Victoria Dr
- 7 Arlington Dr
- 50 E Bryant Ave
- 29 E Bryant Ave
- 42 E Bryant Ave
- 52 E Bryant Ave
- 13 Arlington Ave
- 13 Arlington Dr
- 34 E Bryant Ave
- 62 E Bryant Ave
- 23 E Bryant Ave
- 106 E Bryant Ave
- 410 Victoria Dr
- 28 E Bryant Ave
- 19 Arlington Dr
- 19 Arlington Ave
- 19 E Bryant Ave
- 2 Arlington Dr
Your Personal Tour Guide
Ask me questions while you tour the home.