45 E South St Lithopolis, OH 43136
Bloom NeighborhoodEstimated Value: $316,000 - $389,000
2
Beds
2
Baths
2,076
Sq Ft
$172/Sq Ft
Est. Value
About This Home
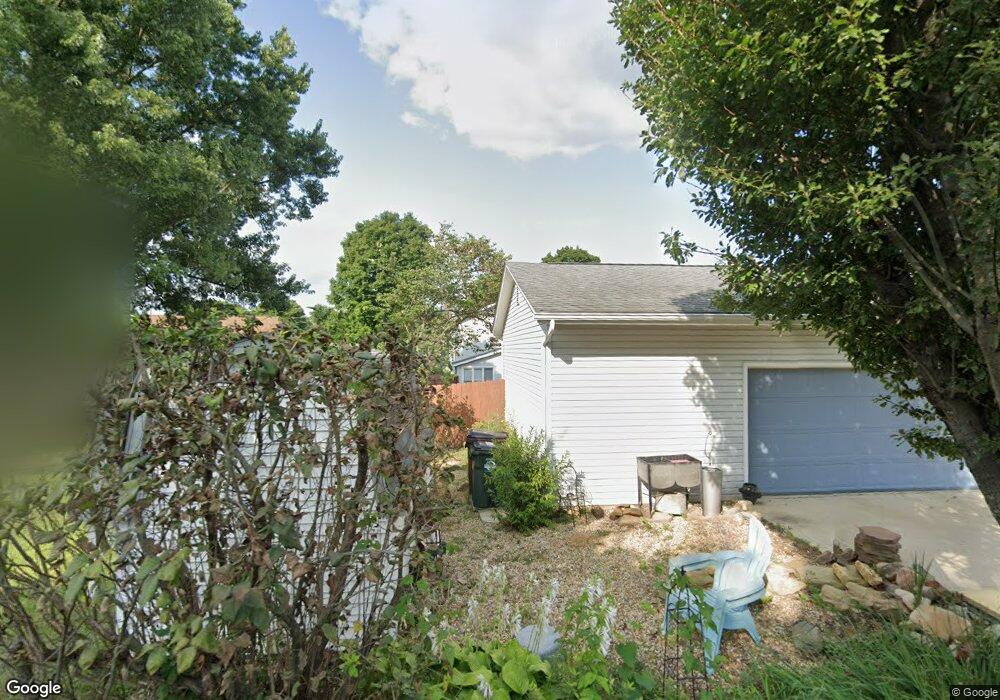
This home is located at 45 E South St, Lithopolis, OH 43136 and is currently estimated at $357,141, approximately $172 per square foot. 45 E South St is a home located in Fairfield County with nearby schools including Bloom Carroll Primary School, Bloom Carroll Intermediate School, and Bloom-Carroll Middle School.
Ownership History
Date
Name
Owned For
Owner Type
Purchase Details
Closed on
Jul 16, 2021
Sold by
Humphrey Joseph M and Humphrey Mary B
Bought by
Kuhn Brenda D and Kuhn David V
Current Estimated Value
Home Financials for this Owner
Home Financials are based on the most recent Mortgage that was taken out on this home.
Original Mortgage
$236,000
Outstanding Balance
$212,617
Interest Rate
3%
Mortgage Type
New Conventional
Estimated Equity
$144,524
Purchase Details
Closed on
Jun 1, 1990
Bought by
Humphrey Joseph M
Purchase Details
Closed on
Dec 1, 1988
Create a Home Valuation Report for This Property
The Home Valuation Report is an in-depth analysis detailing your home's value as well as a comparison with similar homes in the area
Home Values in the Area
Average Home Value in this Area
Purchase History
| Date | Buyer | Sale Price | Title Company |
|---|---|---|---|
| Kuhn Brenda D | $295,000 | First Ohio Title Ins Box | |
| Humphrey Joseph M | $62,200 | -- | |
| -- | $41,500 | -- |
Source: Public Records
Mortgage History
| Date | Status | Borrower | Loan Amount |
|---|---|---|---|
| Open | Kuhn Brenda D | $236,000 |
Source: Public Records
Tax History
| Year | Tax Paid | Tax Assessment Tax Assessment Total Assessment is a certain percentage of the fair market value that is determined by local assessors to be the total taxable value of land and additions on the property. | Land | Improvement |
|---|---|---|---|---|
| 2025 | $7,930 | $133,740 | $26,570 | $107,170 |
| 2024 | $7,930 | $99,870 | $16,740 | $83,130 |
| 2023 | $3,718 | $99,870 | $16,740 | $83,130 |
| 2022 | $3,765 | $99,870 | $16,740 | $83,130 |
| 2021 | $3,566 | $78,410 | $16,740 | $61,670 |
| 2020 | $3,076 | $66,900 | $16,740 | $50,160 |
| 2019 | $3,086 | $66,900 | $16,740 | $50,160 |
| 2018 | $2,277 | $51,400 | $16,740 | $34,660 |
| 2017 | $2,140 | $50,210 | $16,740 | $33,470 |
| 2016 | $2,106 | $50,210 | $16,740 | $33,470 |
| 2015 | $2,105 | $48,860 | $16,740 | $32,120 |
| 2014 | $2,033 | $48,860 | $16,740 | $32,120 |
| 2013 | $2,033 | $48,860 | $16,740 | $32,120 |
Source: Public Records
Map
Nearby Homes
- 19 W Columbus St
- 0 Sycamore Bluff Way
- 0 Columbus St Unit 225023784
- 517 Market St Unit 517
- 539 S Market St
- 678 Green Forest Place
- 777 Faulkner Dr
- 89 Wheatley St
- 680 Crestview Dr
- 1375 Hansberry Dr
- 557 Eastman Ave
- 631 Rolling Acre Dr
- 607 Eastman Ave
- 5225 Lithopolis Winchester Nw Rd
- 146 Poe Ave
- 94 Sandburg Dr
- 248 Faulkner Dr
- 197 Faulkner Dr
- 891 Orwell St
- 290 Jonathan Trail
Your Personal Tour Guide
Ask me questions while you tour the home.