45 Eliot St Sherborn, MA 01770
Estimated Value: $896,374 - $1,028,000
4
Beds
2
Baths
2,063
Sq Ft
$467/Sq Ft
Est. Value
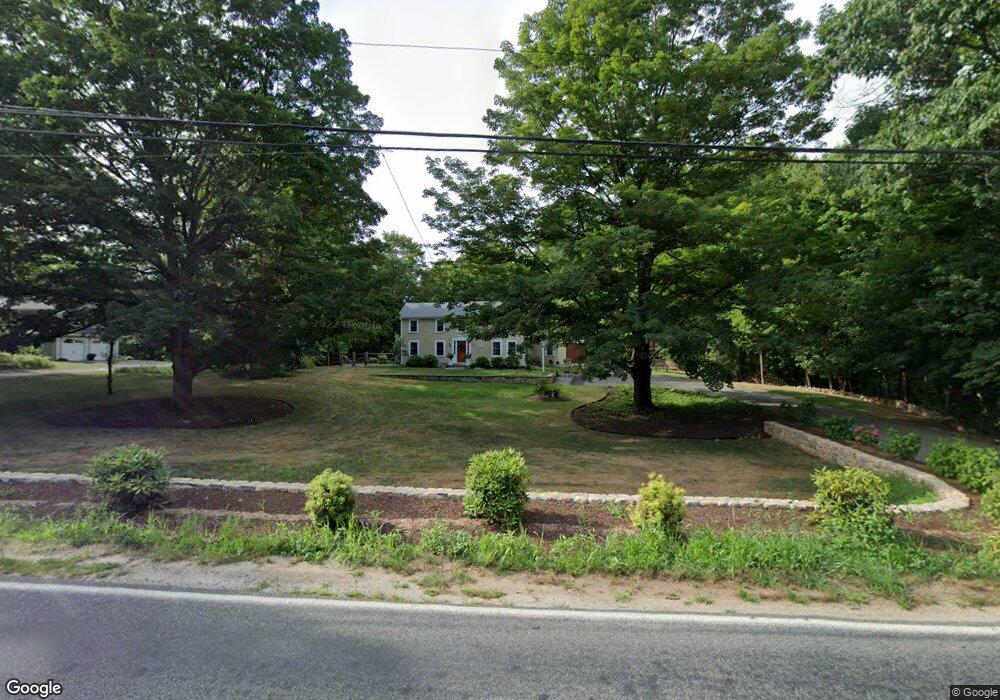
About This Home
This home is located at 45 Eliot St, Sherborn, MA 01770 and is currently estimated at $964,094, approximately $467 per square foot. 45 Eliot St is a home located in Middlesex County with nearby schools including Pine Hill Elementary School, Dover-Sherborn Regional Middle School, and Dover-Sherborn Regional High School.
Ownership History
Date
Name
Owned For
Owner Type
Purchase Details
Closed on
Nov 25, 2024
Sold by
Hartigan Christian M and Hartigan Jessica A
Bought by
Christian M Hartigan Ret and Hartigan
Current Estimated Value
Purchase Details
Closed on
Jul 29, 2011
Sold by
45 Eliot Street Rt and Goldsmith Sonia P
Bought by
Hartigan Christian M and Hartigan Jessica A
Home Financials for this Owner
Home Financials are based on the most recent Mortgage that was taken out on this home.
Original Mortgage
$401,600
Interest Rate
4.52%
Mortgage Type
Purchase Money Mortgage
Create a Home Valuation Report for This Property
The Home Valuation Report is an in-depth analysis detailing your home's value as well as a comparison with similar homes in the area
Home Values in the Area
Average Home Value in this Area
Purchase History
| Date | Buyer | Sale Price | Title Company |
|---|---|---|---|
| Christian M Hartigan Ret | -- | None Available | |
| Christian M Hartigan Ret | -- | None Available | |
| Hartigan Christian M | $502,000 | -- | |
| Hartigan Christian M | $502,000 | -- |
Source: Public Records
Mortgage History
| Date | Status | Borrower | Loan Amount |
|---|---|---|---|
| Previous Owner | Hartigan Christian M | $401,600 |
Source: Public Records
Tax History Compared to Growth
Tax History
| Year | Tax Paid | Tax Assessment Tax Assessment Total Assessment is a certain percentage of the fair market value that is determined by local assessors to be the total taxable value of land and additions on the property. | Land | Improvement |
|---|---|---|---|---|
| 2025 | $12,841 | $774,500 | $375,400 | $399,100 |
| 2024 | $12,128 | $715,500 | $317,900 | $397,600 |
| 2023 | $12,492 | $693,600 | $317,900 | $375,700 |
| 2022 | $11,740 | $616,900 | $316,500 | $300,400 |
| 2021 | $12,110 | $616,900 | $316,500 | $300,400 |
| 2020 | $11,707 | $601,600 | $316,500 | $285,100 |
| 2019 | $11,503 | $586,300 | $316,500 | $269,800 |
| 2018 | $11,316 | $586,300 | $316,500 | $269,800 |
| 2017 | $11,012 | $538,200 | $301,400 | $236,800 |
| 2016 | $11,071 | $538,200 | $301,400 | $236,800 |
| 2015 | $10,881 | $535,500 | $293,400 | $242,100 |
| 2014 | $10,160 | $499,500 | $276,400 | $223,100 |
Source: Public Records
Map
Nearby Homes