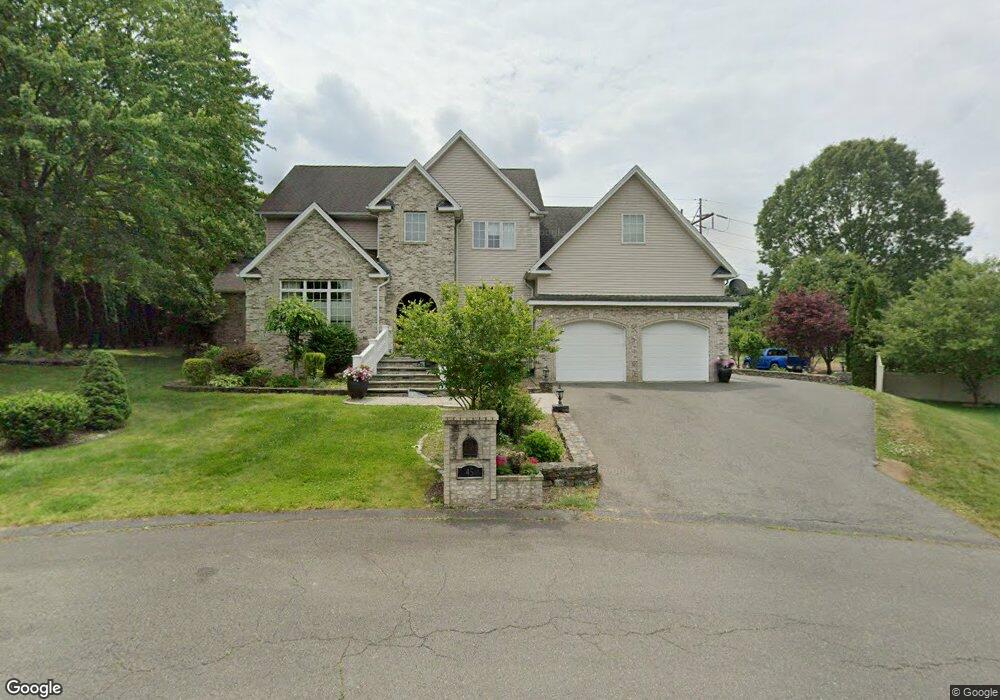
45 Emma Way Ludlow, MA 01056
Estimated Value: $602,000 - $650,306
3
Beds
3
Baths
3,342
Sq Ft
$190/Sq Ft
Est. Value
About This Home
This home is located at 45 Emma Way, Ludlow, MA 01056 and is currently estimated at $636,327, approximately $190 per square foot. 45 Emma Way is a home located in Hampden County with nearby schools including East Street Elementary School, Chapin Street Elementary School, and Paul R. Baird Middle School.
Ownership History
Date
Name
Owned For
Owner Type
Purchase Details
Closed on
Dec 23, 2005
Sold by
Alm Group Llc and Goncalves
Bought by
Quiterio Angelo V and Quiterio Dina M
Current Estimated Value
Home Financials for this Owner
Home Financials are based on the most recent Mortgage that was taken out on this home.
Original Mortgage
$270,000
Interest Rate
6.36%
Mortgage Type
Purchase Money Mortgage
Create a Home Valuation Report for This Property
The Home Valuation Report is an in-depth analysis detailing your home's value as well as a comparison with similar homes in the area
Home Values in the Area
Average Home Value in this Area
Purchase History
| Date | Buyer | Sale Price | Title Company |
|---|---|---|---|
| Quiterio Angelo V | $352,000 | -- | |
| Quiterio Angelo V | $352,000 | -- |
Source: Public Records
Mortgage History
| Date | Status | Borrower | Loan Amount |
|---|---|---|---|
| Open | Quiterio Angelo V | $309,500 | |
| Closed | Quiterio Angelo V | $311,250 | |
| Closed | Quiterio Angelo V | $270,000 |
Source: Public Records
Tax History
| Year | Tax Paid | Tax Assessment Tax Assessment Total Assessment is a certain percentage of the fair market value that is determined by local assessors to be the total taxable value of land and additions on the property. | Land | Improvement |
|---|---|---|---|---|
| 2025 | $10,254 | $591,000 | $90,100 | $500,900 |
| 2024 | $9,774 | $540,300 | $90,000 | $450,300 |
| 2023 | $9,706 | $497,500 | $82,400 | $415,100 |
| 2022 | $9,133 | $456,900 | $85,800 | $371,100 |
| 2021 | $9,123 | $432,800 | $85,800 | $347,000 |
| 2020 | $8,805 | $427,000 | $84,500 | $342,500 |
| 2019 | $8,437 | $425,700 | $83,700 | $342,000 |
| 2018 | $7,920 | $416,600 | $83,700 | $332,900 |
| 2017 | $7,714 | $416,300 | $83,000 | $333,300 |
| 2016 | $7,669 | $423,000 | $81,400 | $341,600 |
| 2015 | $7,243 | $418,900 | $80,500 | $338,400 |
Source: Public Records
Map
Nearby Homes
- 42 Roy St
- 54 Old Fuller rd Extension
- 15 Hilltop Terrace
- 1045-1047 Worcester St
- 28 Mockingbird Dr
- 208 West St
- 76 Hampden St
- 166-168 Main St
- 175 Fiberloid St
- Lot 602 Grandview Ave
- 83 Grandview Ave
- 365 Water St Unit 367
- 83 Loomis Dr
- 9 Post Rd
- 295 Main St
- 1019 Burnett Rd
- 0 N S Main St Io
- 36 Daniel St
- 96 Lyons St
- 145 Moxon St
Your Personal Tour Guide
Ask me questions while you tour the home.