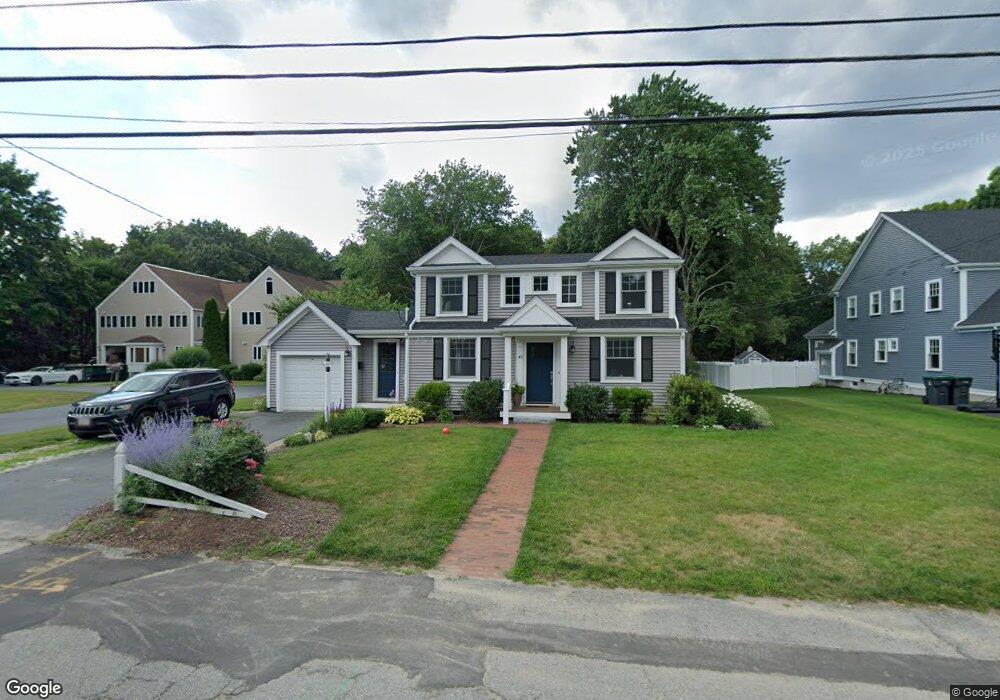
45 Fiske St Natick, MA 01760
Estimated Value: $1,009,000 - $1,088,000
4
Beds
3
Baths
2,284
Sq Ft
$457/Sq Ft
Est. Value
About This Home
This home is located at 45 Fiske St, Natick, MA 01760 and is currently estimated at $1,043,284, approximately $456 per square foot. 45 Fiske St is a home located in Middlesex County with nearby schools including Natick High School, J F Kennedy Middle School, and Johnson Elementary School.
Ownership History
Date
Name
Owned For
Owner Type
Purchase Details
Closed on
Jun 6, 1990
Sold by
Martin Thomas H
Bought by
Eldridge Gregory J
Current Estimated Value
Create a Home Valuation Report for This Property
The Home Valuation Report is an in-depth analysis detailing your home's value as well as a comparison with similar homes in the area
Home Values in the Area
Average Home Value in this Area
Purchase History
| Date | Buyer | Sale Price | Title Company |
|---|---|---|---|
| Eldridge Gregory J | $169,000 | -- |
Source: Public Records
Mortgage History
| Date | Status | Borrower | Loan Amount |
|---|---|---|---|
| Open | Eldridge Gregory J | $260,000 | |
| Closed | Eldridge Gregory J | $250,000 | |
| Closed | Eldridge Gregory J | $140,000 |
Source: Public Records
Tax History
| Year | Tax Paid | Tax Assessment Tax Assessment Total Assessment is a certain percentage of the fair market value that is determined by local assessors to be the total taxable value of land and additions on the property. | Land | Improvement |
|---|---|---|---|---|
| 2025 | $10,001 | $836,200 | $461,200 | $375,000 |
| 2024 | $9,593 | $782,500 | $433,900 | $348,600 |
| 2023 | $9,057 | $716,500 | $414,400 | $302,100 |
| 2022 | $8,716 | $653,400 | $373,800 | $279,600 |
| 2021 | $20 | $614,300 | $352,400 | $261,900 |
| 2020 | $8,143 | $598,300 | $336,400 | $261,900 |
| 2019 | $21 | $598,300 | $336,400 | $261,900 |
| 2018 | $7,497 | $574,500 | $320,400 | $254,100 |
| 2017 | $7,148 | $529,900 | $280,500 | $249,400 |
| 2016 | $6,876 | $506,700 | $259,500 | $247,200 |
| 2015 | $6,681 | $483,400 | $259,500 | $223,900 |
Source: Public Records
Map
Nearby Homes
- 28 Sylvester Rd
- 79 Speen St
- 1 Fern St
- 5 Lanes End
- 46 Silver Hill Ln Unit 1
- 36 Silver Hill Ln Unit 21
- 3 Silver Hill Ln Unit 6
- 26 Wellesley Ave Unit B
- 1 Post Oak Ln Unit 19
- 34 Walden Dr Unit 5
- 8 Walden Dr Unit 13
- 16 West St
- 62 Oakland St
- 57 Village Brook Ln Unit 5
- 52 Village Brook Ln Unit 14
- 89 W Central St
- 15 Village Way Unit 8
- 25 Forest Ave
- 21 Kelsey Rd
- 5 Reynolds Ave Unit 2
Your Personal Tour Guide
Ask me questions while you tour the home.