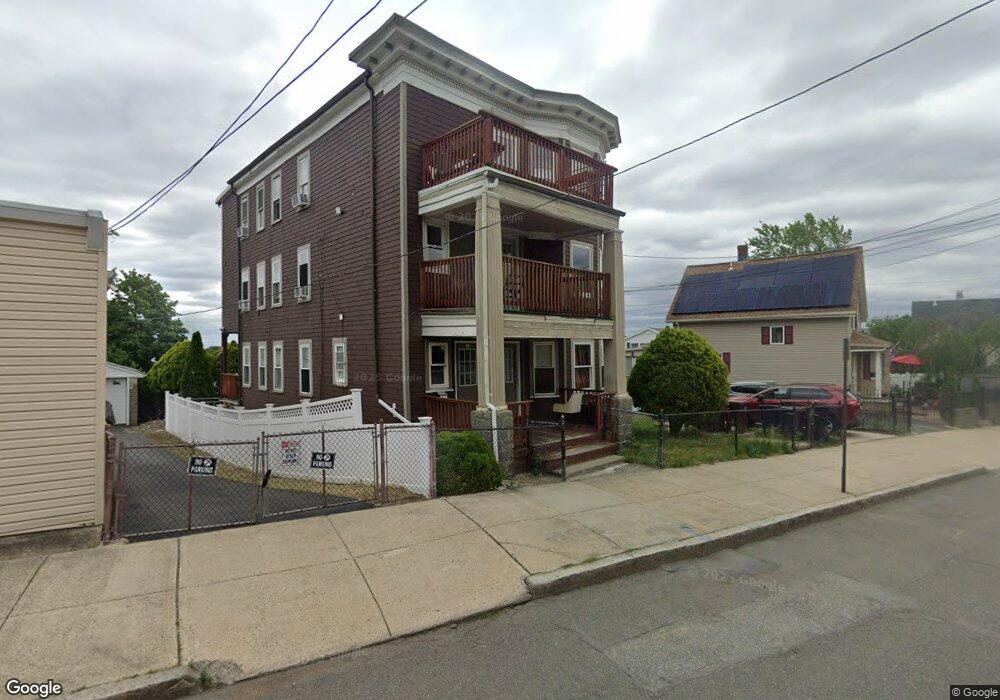
45 Foster St Everett, MA 02149
Glendale NeighborhoodEstimated Value: $683,665 - $1,057,000
Studio
3
Baths
3,393
Sq Ft
$266/Sq Ft
Est. Value
About This Home
This home is located at 45 Foster St, Everett, MA 02149 and is currently estimated at $901,416, approximately $265 per square foot. 45 Foster St is a home located in Middlesex County with nearby schools including Everett High School and Pioneer Charter School of Science.
Ownership History
Date
Name
Owned For
Owner Type
Purchase Details
Closed on
Dec 31, 1998
Sold by
Foster Rt and Dipietro
Bought by
Dicenso Rosolino
Current Estimated Value
Home Financials for this Owner
Home Financials are based on the most recent Mortgage that was taken out on this home.
Original Mortgage
$174,248
Outstanding Balance
$36,099
Interest Rate
6.84%
Mortgage Type
Purchase Money Mortgage
Estimated Equity
$865,317
Purchase Details
Closed on
Jun 30, 1989
Sold by
Gardner Eliz M
Bought by
Depietro Rocco E
Home Financials for this Owner
Home Financials are based on the most recent Mortgage that was taken out on this home.
Original Mortgage
$168,000
Interest Rate
10.56%
Mortgage Type
Purchase Money Mortgage
Create a Home Valuation Report for This Property
The Home Valuation Report is an in-depth analysis detailing your home's value as well as a comparison with similar homes in the area
Home Values in the Area
Average Home Value in this Area
Purchase History
| Date | Buyer | Sale Price | Title Company |
|---|---|---|---|
| Dicenso Rosolino | $178,400 | -- | |
| Depietro Rocco E | $210,000 | -- | |
| Depietro Rocco E | $210,000 | -- |
Source: Public Records
Mortgage History
| Date | Status | Borrower | Loan Amount |
|---|---|---|---|
| Open | Depietro Rocco E | $174,248 | |
| Previous Owner | Depietro Rocco E | $168,000 | |
| Previous Owner | Depietro Rocco E | $140,000 |
Source: Public Records
Tax History
| Year | Tax Paid | Tax Assessment Tax Assessment Total Assessment is a certain percentage of the fair market value that is determined by local assessors to be the total taxable value of land and additions on the property. | Land | Improvement |
|---|---|---|---|---|
| 2025 | $8,719 | $765,500 | $222,500 | $543,000 |
| 2024 | $8,185 | $714,200 | $212,800 | $501,400 |
| 2023 | $8,002 | $679,300 | $198,300 | $481,000 |
| 2022 | $6,558 | $633,000 | $188,600 | $444,400 |
| 2021 | $5,941 | $601,900 | $171,700 | $430,200 |
| 2020 | $6,080 | $571,400 | $171,700 | $399,700 |
| 2019 | $6,387 | $515,900 | $160,100 | $355,800 |
| 2018 | $6,038 | $438,200 | $139,300 | $298,900 |
| 2017 | $5,942 | $411,500 | $116,100 | $295,400 |
| 2016 | $5,491 | $380,000 | $116,100 | $263,900 |
| 2015 | $5,146 | $352,200 | $103,700 | $248,500 |
Source: Public Records
Map
Nearby Homes
- 110 Ferry St
- 11 Hampshire St
- 30 Woodlawn St
- 37 Argyle St
- 15 Waverly Ave
- 44 Walnut St
- 55 Garland St
- 121 Cottage St
- 53 Sycamore St
- 30 Clarence St
- 114 Francis St
- 30 Chelsea St Unit 210
- 181 Chelsea St
- 15 Staples Ave Unit 45
- 15 Staples Ave Unit 31
- 17 Jones St Unit 2
- 21 Staples Ave Unit 26
- 21 Central Ave Unit 10
- 238 Chelsea St
- 12 Hamilton St Unit 8
Your Personal Tour Guide
Ask me questions while you tour the home.