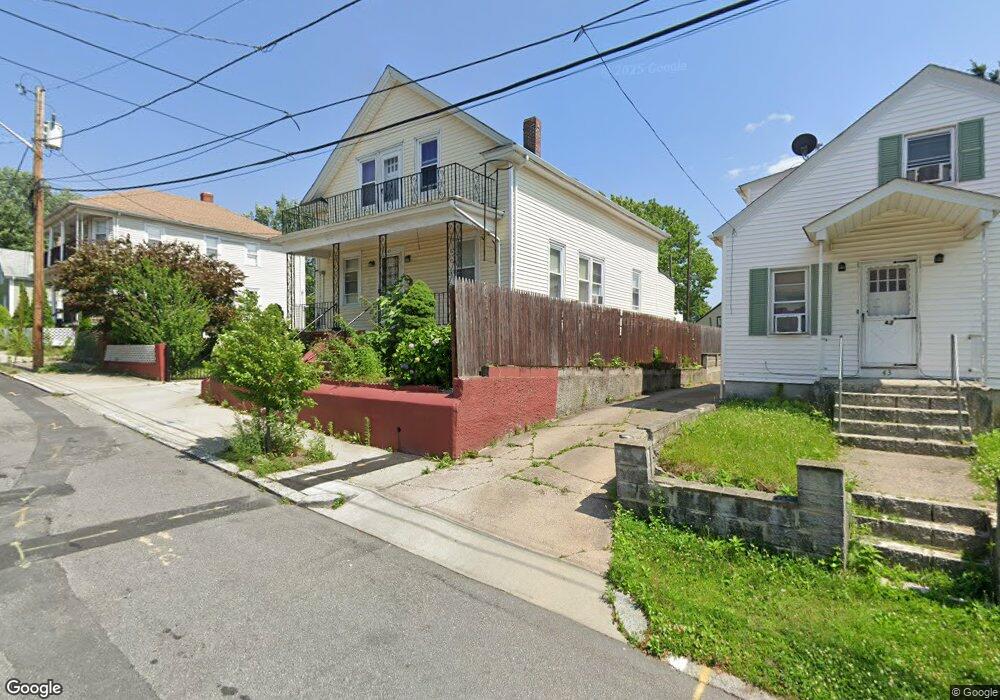
45 Gillen St Providence, RI 02904
Charles NeighborhoodEstimated Value: $442,658 - $509,000
5
Beds
2
Baths
1,771
Sq Ft
$267/Sq Ft
Est. Value
About This Home
This home is located at 45 Gillen St, Providence, RI 02904 and is currently estimated at $472,165, approximately $266 per square foot. 45 Gillen St is a home located in Providence County with nearby schools including Asa Messer Elementary School, Charles N. Fortes Elementary School, and Veazie Street Elementary School.
Ownership History
Date
Name
Owned For
Owner Type
Purchase Details
Closed on
Sep 23, 2011
Sold by
Aquino Rafael
Bought by
Hernandez Juan C
Current Estimated Value
Home Financials for this Owner
Home Financials are based on the most recent Mortgage that was taken out on this home.
Original Mortgage
$2,500
Outstanding Balance
$1,718
Interest Rate
4.33%
Mortgage Type
Purchase Money Mortgage
Estimated Equity
$470,447
Purchase Details
Closed on
May 27, 2011
Sold by
Sanchez Marco A and Ramirez Amanda A
Bought by
Aquino Rafael
Home Financials for this Owner
Home Financials are based on the most recent Mortgage that was taken out on this home.
Original Mortgage
$50,000
Interest Rate
4.94%
Mortgage Type
Purchase Money Mortgage
Purchase Details
Closed on
Aug 1, 2005
Sold by
Petrarca Pompeo and Dacosta Angela
Bought by
Sanchez Marco A and Ramirez Amanda A
Create a Home Valuation Report for This Property
The Home Valuation Report is an in-depth analysis detailing your home's value as well as a comparison with similar homes in the area
Home Values in the Area
Average Home Value in this Area
Purchase History
| Date | Buyer | Sale Price | Title Company |
|---|---|---|---|
| Hernandez Juan C | $119,000 | -- | |
| Aquino Rafael | $60,100 | -- | |
| Sanchez Marco A | $245,000 | -- |
Source: Public Records
Mortgage History
| Date | Status | Borrower | Loan Amount |
|---|---|---|---|
| Open | Sanchez Marco A | $2,500 | |
| Open | Sanchez Marco A | $115,983 | |
| Previous Owner | Sanchez Marco A | $50,000 |
Source: Public Records
Tax History Compared to Growth
Tax History
| Year | Tax Paid | Tax Assessment Tax Assessment Total Assessment is a certain percentage of the fair market value that is determined by local assessors to be the total taxable value of land and additions on the property. | Land | Improvement |
|---|---|---|---|---|
| 2025 | $3,296 | $436,500 | $131,200 | $305,300 |
| 2024 | $4,837 | $263,600 | $69,700 | $193,900 |
| 2023 | $4,837 | $263,600 | $69,700 | $193,900 |
| 2022 | $4,692 | $263,600 | $69,700 | $193,900 |
| 2021 | $4,281 | $174,300 | $66,100 | $108,200 |
| 2020 | $4,281 | $174,300 | $66,100 | $108,200 |
| 2019 | $4,281 | $174,300 | $66,100 | $108,200 |
| 2018 | $3,953 | $123,700 | $51,100 | $72,600 |
| 2017 | $3,953 | $123,700 | $51,100 | $72,600 |
| 2016 | $3,953 | $123,700 | $51,100 | $72,600 |
| 2015 | $3,813 | $115,200 | $54,100 | $61,100 |
| 2014 | $3,888 | $115,200 | $54,100 | $61,100 |
| 2013 | $3,888 | $115,200 | $54,100 | $61,100 |
Source: Public Records
Map
Nearby Homes