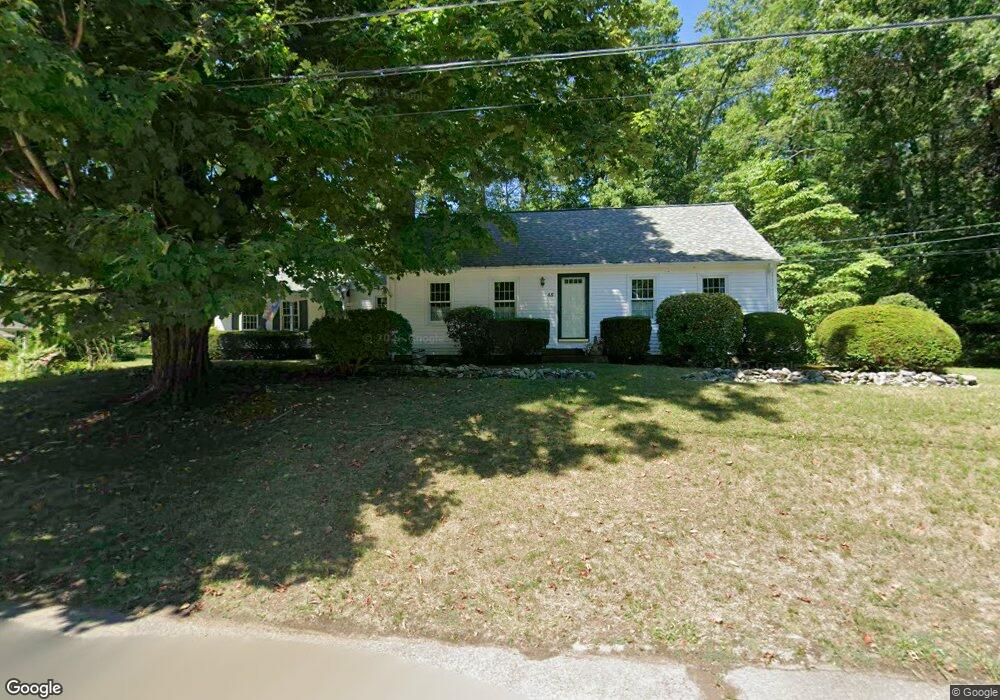
45 Hatch Rd Attleboro, MA 02703
Estimated Value: $543,000 - $652,000
4
Beds
2
Baths
1,900
Sq Ft
$320/Sq Ft
Est. Value
About This Home
This home is located at 45 Hatch Rd, Attleboro, MA 02703 and is currently estimated at $608,569, approximately $320 per square foot. 45 Hatch Rd is a home located in Bristol County with nearby schools including A. Irvin Studley Elementary School, Cyril K. Brennan Middle School, and Attleboro High School.
Ownership History
Date
Name
Owned For
Owner Type
Purchase Details
Closed on
Mar 16, 2015
Sold by
Harrington Charlotte F and Nunes Alice D
Bought by
Alice D Nunes Ret
Current Estimated Value
Purchase Details
Closed on
Nov 13, 2012
Sold by
Harrington Charlotte G
Bought by
Harrington Charlotte G and Nunes Alice D
Purchase Details
Closed on
Dec 30, 1996
Sold by
Spellmeyer Jay C and Spellmeyer Patricia D
Bought by
Harrington Charlotte G
Home Financials for this Owner
Home Financials are based on the most recent Mortgage that was taken out on this home.
Original Mortgage
$45,000
Interest Rate
7.55%
Mortgage Type
Purchase Money Mortgage
Purchase Details
Closed on
Sep 21, 1987
Sold by
Doran Margaret M
Bought by
Spellmeyer Jay S
Create a Home Valuation Report for This Property
The Home Valuation Report is an in-depth analysis detailing your home's value as well as a comparison with similar homes in the area
Home Values in the Area
Average Home Value in this Area
Purchase History
| Date | Buyer | Sale Price | Title Company |
|---|---|---|---|
| Alice D Nunes Ret | -- | -- | |
| Harrington Charlotte G | -- | -- | |
| Harrington Charlotte G | $161,500 | -- | |
| Spellmeyer Jay S | $160,000 | -- |
Source: Public Records
Mortgage History
| Date | Status | Borrower | Loan Amount |
|---|---|---|---|
| Previous Owner | Spellmeyer Jay S | $45,000 | |
| Closed | Spellmeyer Jay S | $0 |
Source: Public Records
Tax History Compared to Growth
Tax History
| Year | Tax Paid | Tax Assessment Tax Assessment Total Assessment is a certain percentage of the fair market value that is determined by local assessors to be the total taxable value of land and additions on the property. | Land | Improvement |
|---|---|---|---|---|
| 2025 | $6,172 | $491,800 | $166,200 | $325,600 |
| 2024 | $5,759 | $452,400 | $149,600 | $302,800 |
| 2023 | $5,581 | $407,700 | $151,000 | $256,700 |
| 2022 | $5,279 | $365,300 | $144,000 | $221,300 |
| 2021 | $5,579 | $347,700 | $138,600 | $209,100 |
| 2020 | $5,216 | $335,000 | $132,200 | $202,800 |
| 2019 | $4,557 | $321,800 | $129,800 | $192,000 |
| 2018 | $4,332 | $292,300 | $126,000 | $166,300 |
| 2017 | $4,147 | $285,000 | $122,800 | $162,200 |
| 2016 | $3,944 | $266,100 | $114,600 | $151,500 |
| 2015 | $3,726 | $253,300 | $114,600 | $138,700 |
| 2014 | $3,641 | $245,200 | $109,600 | $135,600 |
Source: Public Records
Map
Nearby Homes