45 Hemlock Rd West Roxbury, MA 02132
Upper Washington-Spring Street NeighborhoodEstimated Value: $703,224 - $829,000
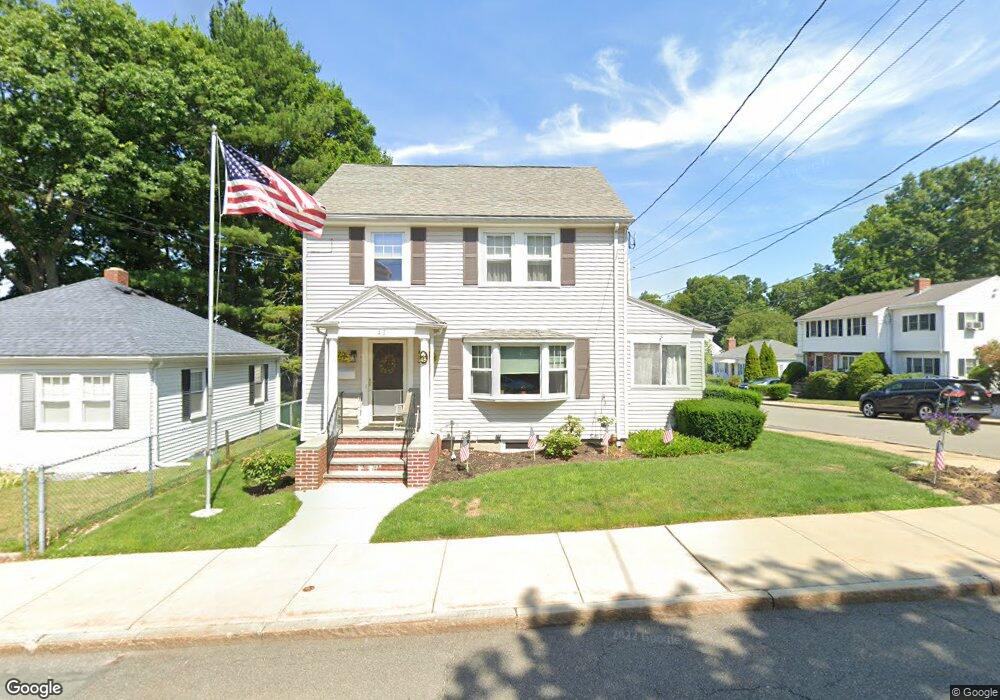
About This Home
This home is located at 45 Hemlock Rd, West Roxbury, MA 02132 and is currently estimated at $764,806, approximately $488 per square foot. 45 Hemlock Rd is a home located in Suffolk County with nearby schools including Beethoven Elementary School, Charles H. Taylor Elementary School, and Blackstone Elementary.
Ownership History
We collect this data history from publicly available records. To have your information removed, we recommend requesting removal directly through your county’s website.
Purchase Details
Home Values in the Area
Average Home Value in this Area
Purchase History
We collect this data history from publicly available records. To have your information removed, we recommend requesting removal directly through your county’s website.
| Date | Buyer | Sale Price | Title Company |
|---|---|---|---|
| $150,000 | -- |
Mortgage History
We collect this data history from publicly available records. To have your information removed, we recommend requesting removal directly through your county’s website.
| Date | Status | Borrower | Loan Amount |
|---|---|---|---|
| Closed | $234,000 | ||
| Closed | $222,500 | ||
| Closed | $50,000 | ||
| Closed | $142,000 | ||
| Closed | $135,000 | ||
| Closed | $145,000 | ||
| Closed | $22,710 | ||
| Closed | $15,000 | ||
| Closed | $125,500 |
Tax History
We collect this data history from publicly available records. To have your information removed, we recommend requesting removal directly through your county’s website.
| Year | Tax Paid | Tax Assessment Tax Assessment Total Assessment is a certain percentage of the fair market value that is determined by local assessors to be the total taxable value of land and additions on the property. | Land | Improvement |
|---|---|---|---|---|
| 2025 | $6,911 | $596,800 | $175,500 | $421,300 |
| 2024 | $5,911 | $542,300 | $179,000 | $363,300 |
| 2023 | $5,824 | $542,300 | $179,000 | $363,300 |
| 2022 | $5,365 | $493,100 | $162,800 | $330,300 |
| 2021 | $4,893 | $458,600 | $155,000 | $303,600 |
| 2020 | $4,674 | $442,600 | $144,400 | $298,200 |
| 2019 | $4,403 | $417,700 | $117,800 | $299,900 |
| 2018 | $4,053 | $386,700 | $117,800 | $268,900 |
| 2017 | $4,053 | $382,700 | $117,800 | $264,900 |
| 2016 | $4,158 | $378,000 | $117,800 | $260,200 |
| 2015 | $4,178 | $345,000 | $129,800 | $215,200 |
| 2014 | $4,057 | $322,500 | $129,800 | $192,700 |
Map
- 67 Billings St
- 23 Eastwood Circuit
- 92 Laurie Ave
- 25 Breede Terrace
- 19 New Haven St
- 8 Breede Terrace
- 82 Needham St
- 29 Keystone St
- 33 Paragon Rd
- 20 Riverview St
- 37 Riverview St
- 11 Hartlawn Rd
- 114 Glenellen Rd
- 63 Johnson St
- 2445 Centre St
- 66 Wycliff Ave
- 70 Gardner St
- 15 Cass St Unit 3
- 41 Bronx Rd
- 116 Spring St Unit A8
Ask me questions while you tour the home.