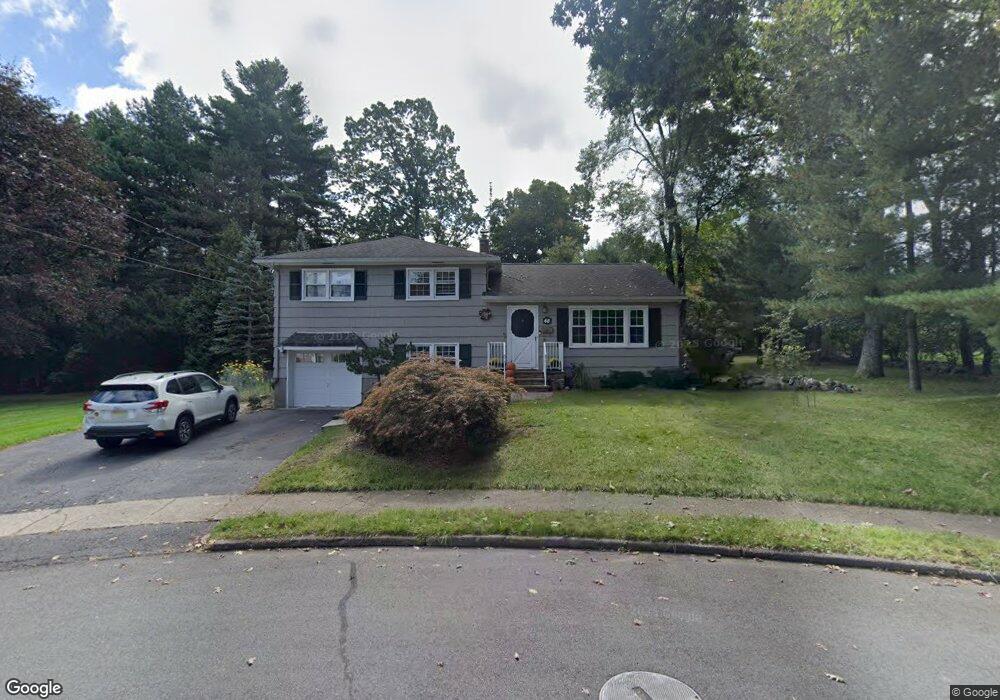
45 Hemlock St Midland Park, NJ 07432
Estimated Value: $638,000 - $753,487
--
Bed
--
Bath
1,508
Sq Ft
$463/Sq Ft
Est. Value
About This Home
This home is located at 45 Hemlock St, Midland Park, NJ 07432 and is currently estimated at $698,372, approximately $463 per square foot. 45 Hemlock St is a home located in Bergen County with nearby schools including Godwin Elementary School, Highland Elementary School, and Midland Park Jr./Sr. High School.
Ownership History
Date
Name
Owned For
Owner Type
Purchase Details
Closed on
Sep 13, 2021
Sold by
Reicher Norman J and Reicher Norman Jed
Bought by
Reicher Jody Lynn
Current Estimated Value
Purchase Details
Closed on
Jun 4, 1998
Sold by
Hannigan Joan and Macmillan Bruce A
Bought by
Reicher Norman J and Lynn Reicher Jody
Home Financials for this Owner
Home Financials are based on the most recent Mortgage that was taken out on this home.
Original Mortgage
$180,000
Interest Rate
6.66%
Mortgage Type
Purchase Money Mortgage
Create a Home Valuation Report for This Property
The Home Valuation Report is an in-depth analysis detailing your home's value as well as a comparison with similar homes in the area
Home Values in the Area
Average Home Value in this Area
Purchase History
| Date | Buyer | Sale Price | Title Company |
|---|---|---|---|
| Reicher Jody Lynn | -- | None Listed On Document | |
| Reicher Norman J | $255,000 | -- |
Source: Public Records
Mortgage History
| Date | Status | Borrower | Loan Amount |
|---|---|---|---|
| Previous Owner | Reicher Norman J | $180,000 |
Source: Public Records
Tax History Compared to Growth
Tax History
| Year | Tax Paid | Tax Assessment Tax Assessment Total Assessment is a certain percentage of the fair market value that is determined by local assessors to be the total taxable value of land and additions on the property. | Land | Improvement |
|---|---|---|---|---|
| 2025 | $13,986 | $401,900 | $249,300 | $152,600 |
| 2024 | $13,588 | $401,900 | $249,300 | $152,600 |
| 2023 | $13,070 | $401,900 | $249,300 | $152,600 |
| 2022 | $13,070 | $401,900 | $249,300 | $152,600 |
| 2021 | $12,845 | $401,900 | $249,300 | $152,600 |
| 2020 | $12,531 | $401,900 | $249,300 | $152,600 |
| 2019 | $12,226 | $401,900 | $249,300 | $152,600 |
| 2018 | $12,005 | $401,900 | $249,300 | $152,600 |
| 2017 | $11,804 | $401,900 | $249,300 | $152,600 |
| 2016 | $11,514 | $401,900 | $249,300 | $152,600 |
| 2015 | $11,297 | $401,900 | $249,300 | $152,600 |
| 2014 | $10,815 | $401,900 | $249,300 | $152,600 |
Source: Public Records
Map
Nearby Homes