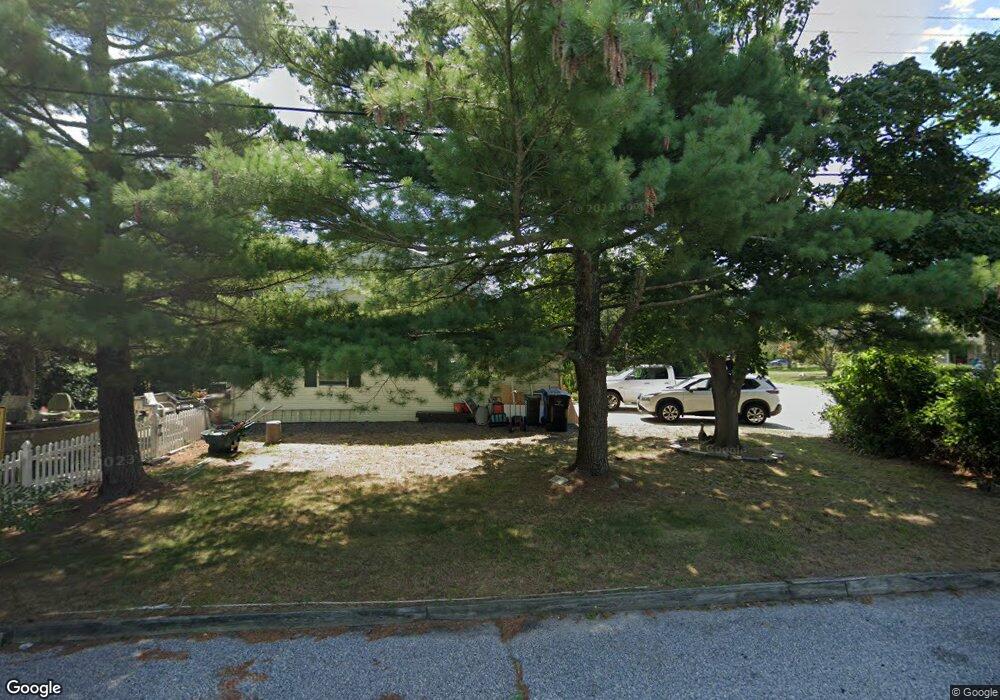
45 Highland Ave Marmora, NJ 08223
Estimated Value: $387,000 - $600,000
Studio
--
Bath
1,722
Sq Ft
$282/Sq Ft
Est. Value
About This Home
This home is located at 45 Highland Ave, Marmora, NJ 08223 and is currently estimated at $485,541, approximately $281 per square foot. 45 Highland Ave is a home located in Cape May County with nearby schools including Upper Township Primary School, Upper Township Elementary School, and Upper Township Middle School.
Ownership History
Date
Name
Owned For
Owner Type
Purchase Details
Closed on
May 20, 2022
Sold by
Powell Patricia A
Bought by
Smith Randall Edwin
Current Estimated Value
Purchase Details
Closed on
Aug 19, 2005
Sold by
Fieo Angela
Bought by
Powell William T and Powell Patricia A
Home Financials for this Owner
Home Financials are based on the most recent Mortgage that was taken out on this home.
Original Mortgage
$232,000
Interest Rate
5.68%
Mortgage Type
Fannie Mae Freddie Mac
Create a Home Valuation Report for This Property
The Home Valuation Report is an in-depth analysis detailing your home's value as well as a comparison with similar homes in the area
Home Values in the Area
Average Home Value in this Area
Purchase History
| Date | Buyer | Sale Price | Title Company |
|---|---|---|---|
| Smith Randall Edwin | $265,000 | New Title Company Name | |
| Powell William T | $290,000 | Commonwealth Land Title Insu |
Source: Public Records
Mortgage History
| Date | Status | Borrower | Loan Amount |
|---|---|---|---|
| Previous Owner | Powell William T | $232,000 |
Source: Public Records
Tax History
| Year | Tax Paid | Tax Assessment Tax Assessment Total Assessment is a certain percentage of the fair market value that is determined by local assessors to be the total taxable value of land and additions on the property. | Land | Improvement |
|---|---|---|---|---|
| 2025 | $5,480 | $238,800 | $117,700 | $121,100 |
| 2024 | $5,480 | $238,800 | $117,700 | $121,100 |
| 2023 | $5,211 | $238,800 | $117,700 | $121,100 |
| 2022 | $5,020 | $238,800 | $117,700 | $121,100 |
| 2021 | $4,838 | $238,800 | $117,700 | $121,100 |
| 2020 | $4,654 | $238,800 | $117,700 | $121,100 |
| 2019 | $4,530 | $238,800 | $117,700 | $121,100 |
| 2018 | $4,411 | $238,800 | $117,700 | $121,100 |
| 2017 | $4,356 | $238,800 | $117,700 | $121,100 |
| 2016 | $3,955 | $213,200 | $117,700 | $95,500 |
| 2015 | $3,848 | $213,200 | $117,700 | $95,500 |
| 2014 | $4,344 | $295,100 | $171,800 | $123,300 |
Source: Public Records
Map
Nearby Homes
- 29 E Hollywood Ln
- 516 Route Us 9 N
- 11 Wilkie Blvd
- 110 E Hollywood Ln
- 17 E Golden Oak Ln
- 16 Lenape Ln
- 145 Allendale Rd
- 11 Redwish Ave
- 202 N Shore Rd
- 125 N Shore
- 14 Lyndhurst Rd
- 1 Roosevelt Blvd
- 100 Reef Dr Unit 94
- 3 Spinnaker Ct Unit 3
- 9 Coral Ln
- 22 Marshall Ln
- 1904 Glenwood Dr
- 22 Red Clover Dr
- 14 Caroline Ln
- 3103 Bayland Dr
Your Personal Tour Guide
Ask me questions while you tour the home.