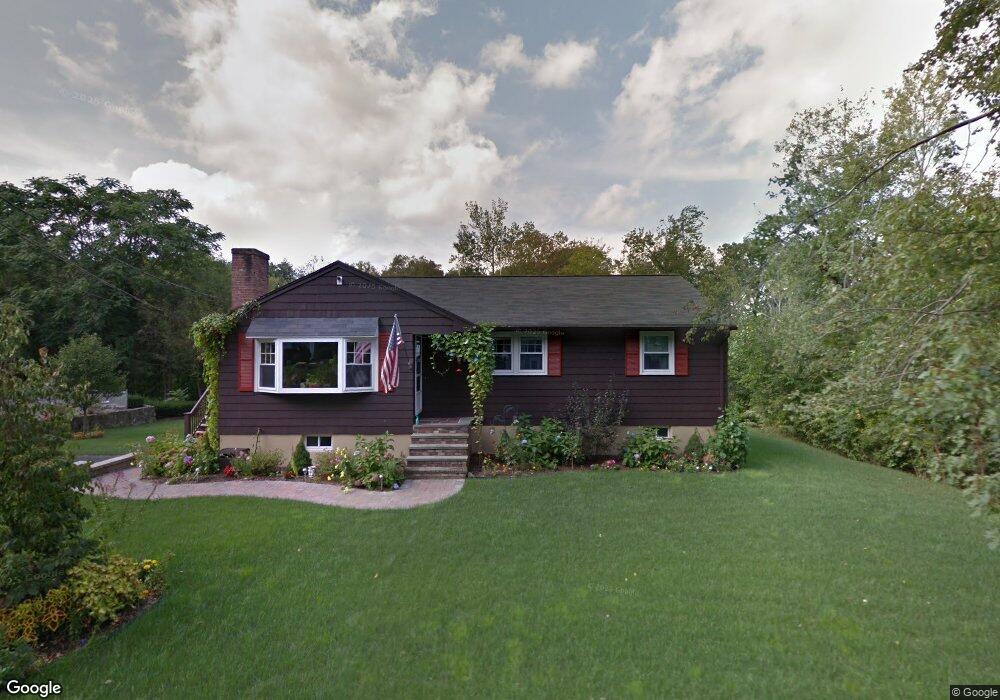
45 Hobson St Saugus, MA 01906
North Saugus NeighborhoodEstimated Value: $620,000 - $716,000
3
Beds
2
Baths
1,208
Sq Ft
$541/Sq Ft
Est. Value
About This Home
This home is located at 45 Hobson St, Saugus, MA 01906 and is currently estimated at $653,955, approximately $541 per square foot. 45 Hobson St is a home located in Essex County with nearby schools including Saugus High School, Pioneer Charter School Of Science II, and Our Lady Of Assumption School.
Ownership History
Date
Name
Owned For
Owner Type
Purchase Details
Closed on
Mar 21, 2025
Sold by
Zapolski Charles E
Bought by
Charles E Zapolski Irt and Zapolski
Current Estimated Value
Purchase Details
Closed on
Jun 14, 1978
Bought by
Zapolski Charles E and Zapolski Kathy S
Create a Home Valuation Report for This Property
The Home Valuation Report is an in-depth analysis detailing your home's value as well as a comparison with similar homes in the area
Home Values in the Area
Average Home Value in this Area
Purchase History
| Date | Buyer | Sale Price | Title Company |
|---|---|---|---|
| Charles E Zapolski Irt | -- | None Available | |
| Charles E Zapolski Irt | -- | None Available | |
| Charles E Zapolski Irt | -- | None Available | |
| Zapolski Charles E | -- | -- |
Source: Public Records
Mortgage History
| Date | Status | Borrower | Loan Amount |
|---|---|---|---|
| Previous Owner | Zapolski Charles E | $30,000 |
Source: Public Records
Tax History
| Year | Tax Paid | Tax Assessment Tax Assessment Total Assessment is a certain percentage of the fair market value that is determined by local assessors to be the total taxable value of land and additions on the property. | Land | Improvement |
|---|---|---|---|---|
| 2025 | $5,786 | $541,800 | $333,000 | $208,800 |
| 2024 | $5,634 | $529,000 | $324,000 | $205,000 |
| 2023 | $5,408 | $480,300 | $283,500 | $196,800 |
| 2022 | $5,348 | $445,300 | $263,700 | $181,600 |
| 2021 | $4,940 | $400,300 | $218,700 | $181,600 |
| 2020 | $4,643 | $389,500 | $207,900 | $181,600 |
| 2019 | $4,541 | $372,800 | $198,000 | $174,800 |
| 2018 | $4,135 | $357,100 | $189,000 | $168,100 |
| 2017 | $3,862 | $320,500 | $180,000 | $140,500 |
| 2016 | $3,760 | $308,200 | $170,900 | $137,300 |
| 2015 | $3,528 | $293,500 | $162,800 | $130,700 |
| 2014 | $3,320 | $286,000 | $162,800 | $123,200 |
Source: Public Records
Map
Nearby Homes
- 227 Walnut St
- 7 Central St
- 801 Sherwood Forest Ln
- 29 Susan Dr
- 921 Sherwood Forest Ln
- 7 Nirvana Dr
- 9 Broadway Unit 210
- 9 Broadway Unit 217
- 24 Palmetto St
- 5 Thomas St Unit 8
- 348 Lynn Fells Pkwy
- 148 Forest St
- 67 Saville St
- 43 W Sigourney St
- 115 Quinn Rd
- 151 Dartmouth St
- 52 Hesper St
- 26 Joel Cir
- 344 Broadway
- 43 Taylor St
Your Personal Tour Guide
Ask me questions while you tour the home.