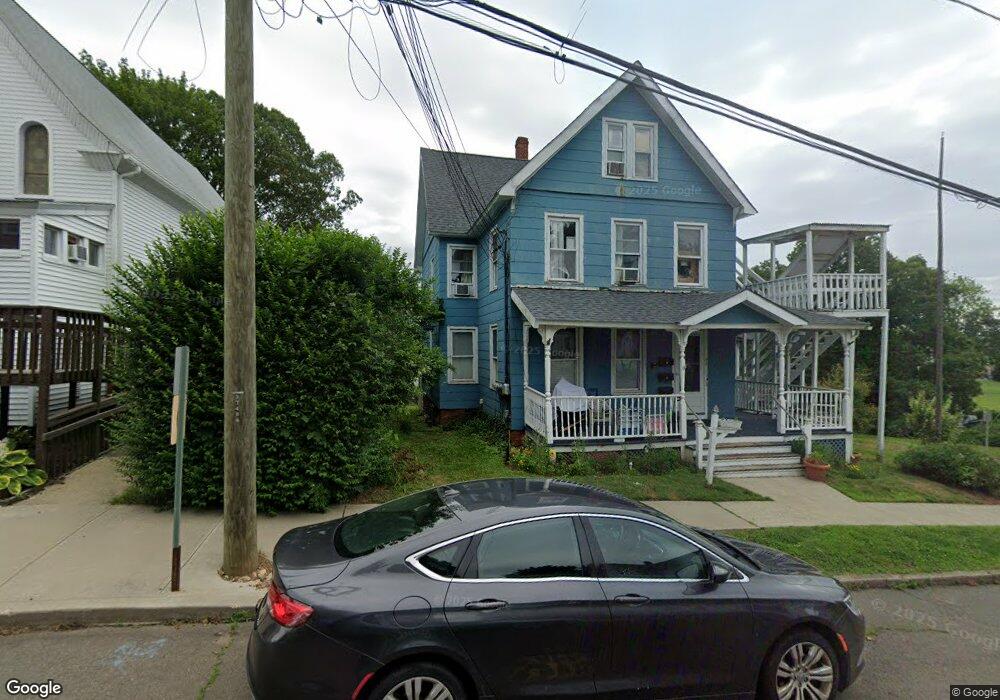
45 Hopson Ave Branford, CT 06405
Estimated Value: $562,307 - $736,000
5
Beds
6
Baths
2,965
Sq Ft
$218/Sq Ft
Est. Value
About This Home
This home is located at 45 Hopson Ave, Branford, CT 06405 and is currently estimated at $645,827, approximately $217 per square foot. 45 Hopson Ave is a home located in New Haven County with nearby schools including Francis Walsh Intermediate School, Branford High School, and East Shoreline Catholic Academy.
Ownership History
Date
Name
Owned For
Owner Type
Purchase Details
Closed on
Apr 1, 2005
Sold by
Martin Joanna and Martin Harvey S
Bought by
Boucher Kenneth M and Boucher Carole F
Current Estimated Value
Home Financials for this Owner
Home Financials are based on the most recent Mortgage that was taken out on this home.
Original Mortgage
$221,000
Outstanding Balance
$112,784
Interest Rate
5.61%
Estimated Equity
$533,043
Create a Home Valuation Report for This Property
The Home Valuation Report is an in-depth analysis detailing your home's value as well as a comparison with similar homes in the area
Home Values in the Area
Average Home Value in this Area
Purchase History
| Date | Buyer | Sale Price | Title Company |
|---|---|---|---|
| Boucher Kenneth M | $340,000 | -- |
Source: Public Records
Mortgage History
| Date | Status | Borrower | Loan Amount |
|---|---|---|---|
| Open | Boucher Kenneth M | $221,000 | |
| Previous Owner | Boucher Kenneth M | $219,000 | |
| Previous Owner | Boucher Kenneth M | $110,000 | |
| Previous Owner | Boucher Kenneth M | $135,000 |
Source: Public Records
Tax History Compared to Growth
Tax History
| Year | Tax Paid | Tax Assessment Tax Assessment Total Assessment is a certain percentage of the fair market value that is determined by local assessors to be the total taxable value of land and additions on the property. | Land | Improvement |
|---|---|---|---|---|
| 2025 | $7,098 | $331,700 | $81,300 | $250,400 |
| 2024 | $7,029 | $230,600 | $68,500 | $162,100 |
| 2023 | $6,893 | $230,600 | $68,500 | $162,100 |
| 2022 | $6,791 | $230,600 | $68,500 | $162,100 |
| 2021 | $6,791 | $230,600 | $68,500 | $162,100 |
| 2020 | $6,669 | $230,600 | $68,500 | $162,100 |
| 2019 | $6,233 | $214,400 | $71,600 | $142,800 |
| 2018 | $6,140 | $214,400 | $71,600 | $142,800 |
| 2017 | $6,104 | $214,400 | $71,600 | $142,800 |
| 2016 | $5,877 | $214,400 | $71,600 | $142,800 |
| 2015 | $5,774 | $214,400 | $71,600 | $142,800 |
| 2014 | $5,545 | $211,300 | $68,500 | $142,800 |
Source: Public Records
Map
Nearby Homes
- 25 S Montowese St
- 45 Ivy St
- 60 Maple St Unit 31
- 16 Pine Orchard Rd Unit 23
- 16 Pine Orchard Rd Unit 14
- 202 Main St
- 26 Cedar Knolls Dr
- 77 Chestnut St
- 7 Dogwood Ct
- 26 N Main St Unit TRLR 19
- 62 S Montowese St
- 74 Quarry Dock Rd
- 58 Quarry Dock Rd
- 48 Montoya Dr Unit 48
- 107 Chestnut St
- 60 Montoya Dr Unit 60
- 251 N Main St
- 301 Maple St
- 49 Riverside Dr
- 18 Linsley St
- 16 Prospect St
- 57 Hopson Ave
- 57 Hopson Ave Unit 1
- 15 Prospect St
- 22 Prospect St Unit 1
- 22 Prospect St
- 48 Hopson Ave
- 52 Hopson Ave
- 42 Hopson Ave
- 42 Hopson Ave Unit 3
- 62 Hopson Ave Unit 64
- 58 Hopson Ave
- 61 Hopson Ave
- 61 Hopson Ave Unit 2nd floor
- 61 Hopson Ave Unit 3rd floor
- 36 Hopson Ave Unit 38
- 28 Prospect St
- 30 Prospect St
- 30 Prospect St Unit 2
- 30 Prospect St Unit 1