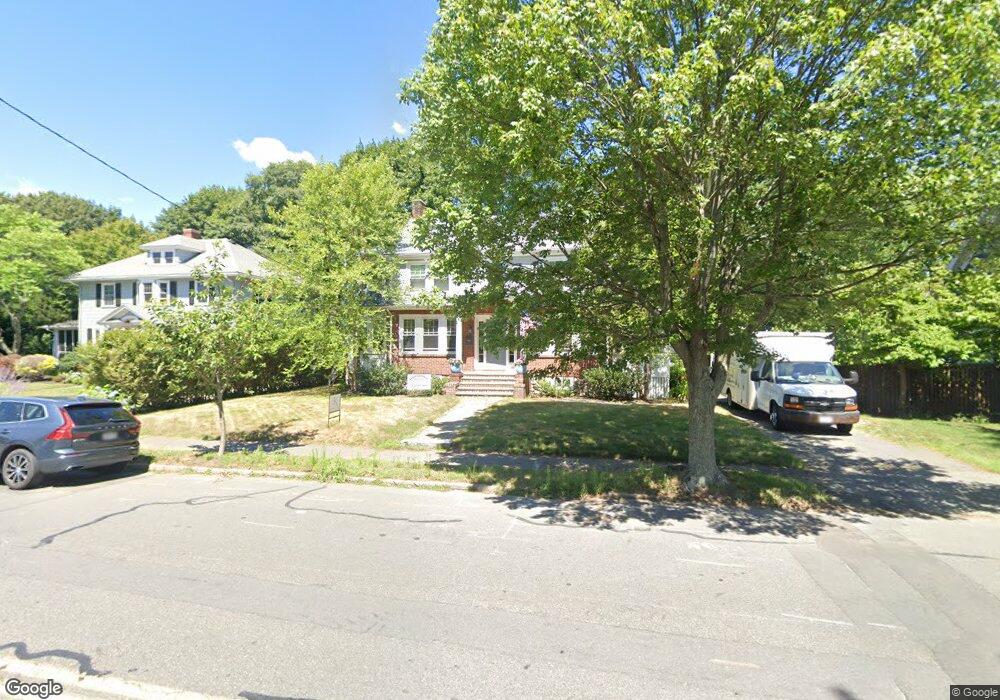
45 Humphrey St Unit 1 Marblehead, MA 01945
Estimated Value: $871,000 - $912,000
3
Beds
1
Bath
1,778
Sq Ft
$505/Sq Ft
Est. Value
About This Home
This home is located at 45 Humphrey St Unit 1, Marblehead, MA 01945 and is currently estimated at $897,885, approximately $504 per square foot. 45 Humphrey St Unit 1 is a home located in Essex County with nearby schools including Marblehead High School, Devereux School, and Tower School.
Ownership History
Date
Name
Owned For
Owner Type
Purchase Details
Closed on
Aug 13, 2020
Sold by
Kiley Daniel E and Kiley Linda A
Bought by
Hobert Caroline R and Oneil Michael
Current Estimated Value
Home Financials for this Owner
Home Financials are based on the most recent Mortgage that was taken out on this home.
Original Mortgage
$528,000
Outstanding Balance
$466,260
Interest Rate
3%
Mortgage Type
New Conventional
Estimated Equity
$431,625
Purchase Details
Closed on
Aug 25, 2017
Sold by
Donovan Patricia E
Bought by
Kiley Daniel E and Kiley Linda A
Home Financials for this Owner
Home Financials are based on the most recent Mortgage that was taken out on this home.
Original Mortgage
$425,000
Interest Rate
3.25%
Mortgage Type
New Conventional
Purchase Details
Closed on
Jan 13, 1972
Bought by
Carter Helen C and Donovan Patricia E
Create a Home Valuation Report for This Property
The Home Valuation Report is an in-depth analysis detailing your home's value as well as a comparison with similar homes in the area
Home Values in the Area
Average Home Value in this Area
Purchase History
| Date | Buyer | Sale Price | Title Company |
|---|---|---|---|
| Hobert Caroline R | $660,000 | None Available | |
| Hobert Caroline R | $660,000 | None Available | |
| Kiley Daniel E | $595,000 | -- | |
| Carter Helen C | -- | -- |
Source: Public Records
Mortgage History
| Date | Status | Borrower | Loan Amount |
|---|---|---|---|
| Open | Hobert Caroline R | $528,000 | |
| Closed | Hobert Caroline R | $528,000 | |
| Previous Owner | Kiley Daniel E | $425,000 | |
| Previous Owner | Carter Helen C | $50,000 |
Source: Public Records
Tax History Compared to Growth
Tax History
| Year | Tax Paid | Tax Assessment Tax Assessment Total Assessment is a certain percentage of the fair market value that is determined by local assessors to be the total taxable value of land and additions on the property. | Land | Improvement |
|---|---|---|---|---|
| 2025 | $7,712 | $852,100 | $548,600 | $303,500 |
| 2024 | $7,047 | $786,500 | $493,700 | $292,800 |
| 2023 | $7,263 | $726,300 | $493,700 | $232,600 |
| 2022 | $6,718 | $638,600 | $411,400 | $227,200 |
| 2021 | $6,331 | $607,600 | $384,000 | $223,600 |
| 2020 | $6,499 | $625,500 | $411,400 | $214,100 |
| 2019 | $6,328 | $589,200 | $384,000 | $205,200 |
| 2018 | $5,826 | $528,700 | $342,800 | $185,900 |
| 2017 | $5,218 | $473,900 | $288,000 | $185,900 |
| 2016 | $4,956 | $446,500 | $260,600 | $185,900 |
| 2015 | $5,081 | $458,600 | $274,300 | $184,300 |
| 2014 | $4,657 | $419,900 | $246,800 | $173,100 |
Source: Public Records
Map
Nearby Homes
- 3 Oak St
- 34 Lafayette St
- 2 Martin St
- 30 Amherst Rd
- 83 Lafayette St
- 282 Pleasant St
- 25 Tedesco St
- 6 Higgins Rd
- 70 Maverick St
- 201 Humphrey St Unit 2
- 19 Elmwood Rd
- 212 Humphrey St Unit 205
- 100 Village St
- 29 Village St Unit 1
- 12 Heritage Way Unit 12
- 41 Rowland St
- 197A W Shore Dr Unit A
- 155 Village St
- 48 Bellevue Rd
- 215 W Shore Dr