45 Jackson St Clifton Vlg, OH 45316
Estimated Value: $253,000 - $289,000
3
Beds
1
Bath
1,848
Sq Ft
$147/Sq Ft
Est. Value
About This Home
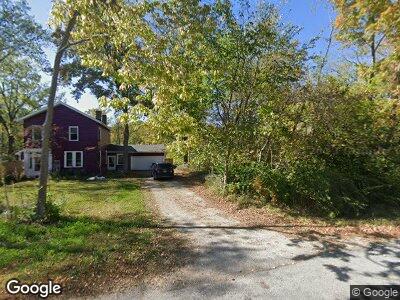
This home is located at 45 Jackson St, Clifton Vlg, OH 45316 and is currently estimated at $272,550, approximately $147 per square foot. 45 Jackson St is a home located in Greene County with nearby schools including Cedarville Elementary School, Cedarville High School, and The Antioch School.
Ownership History
Date
Name
Owned For
Owner Type
Purchase Details
Closed on
Jan 14, 2022
Sold by
Senne William T
Bought by
Kay Jeanne
Current Estimated Value
Home Financials for this Owner
Home Financials are based on the most recent Mortgage that was taken out on this home.
Original Mortgage
$178,400
Outstanding Balance
$146,694
Interest Rate
3.22%
Mortgage Type
New Conventional
Estimated Equity
$125,856
Purchase Details
Closed on
Nov 14, 2008
Sold by
Rainey Christopher B
Bought by
Senne William T and Senne Mary E
Home Financials for this Owner
Home Financials are based on the most recent Mortgage that was taken out on this home.
Original Mortgage
$110,000
Interest Rate
6.04%
Mortgage Type
Unknown
Create a Home Valuation Report for This Property
The Home Valuation Report is an in-depth analysis detailing your home's value as well as a comparison with similar homes in the area
Home Values in the Area
Average Home Value in this Area
Purchase History
| Date | Buyer | Sale Price | Title Company |
|---|---|---|---|
| Kay Jeanne | -- | Fischer William E | |
| Senne William T | $137,500 | Attorney |
Source: Public Records
Mortgage History
| Date | Status | Borrower | Loan Amount |
|---|---|---|---|
| Open | Kay Jeanne | $178,400 | |
| Previous Owner | Senne William T | $106,000 | |
| Previous Owner | Senne William T | $110,000 | |
| Previous Owner | Senne William T | $110,000 | |
| Previous Owner | Rainey Christopher B | $9,463 | |
| Previous Owner | Rainey Christopher B | $82,800 |
Source: Public Records
Tax History Compared to Growth
Tax History
| Year | Tax Paid | Tax Assessment Tax Assessment Total Assessment is a certain percentage of the fair market value that is determined by local assessors to be the total taxable value of land and additions on the property. | Land | Improvement |
|---|---|---|---|---|
| 2024 | $3,264 | $69,180 | $14,300 | $54,880 |
| 2023 | $3,264 | $69,180 | $14,300 | $54,880 |
| 2022 | $2,288 | $41,180 | $12,940 | $28,240 |
| 2021 | $2,198 | $41,180 | $12,940 | $28,240 |
| 2020 | $2,189 | $41,180 | $12,940 | $28,240 |
| 2019 | $2,166 | $38,380 | $12,600 | $25,780 |
| 2018 | $2,179 | $38,380 | $12,600 | $25,780 |
| 2017 | $1,966 | $38,380 | $12,600 | $25,780 |
| 2016 | $1,967 | $36,480 | $11,920 | $24,560 |
| 2015 | $1,964 | $36,480 | $11,920 | $24,560 |
| 2014 | $1,964 | $36,480 | $11,920 | $24,560 |
Source: Public Records
Map
Nearby Homes