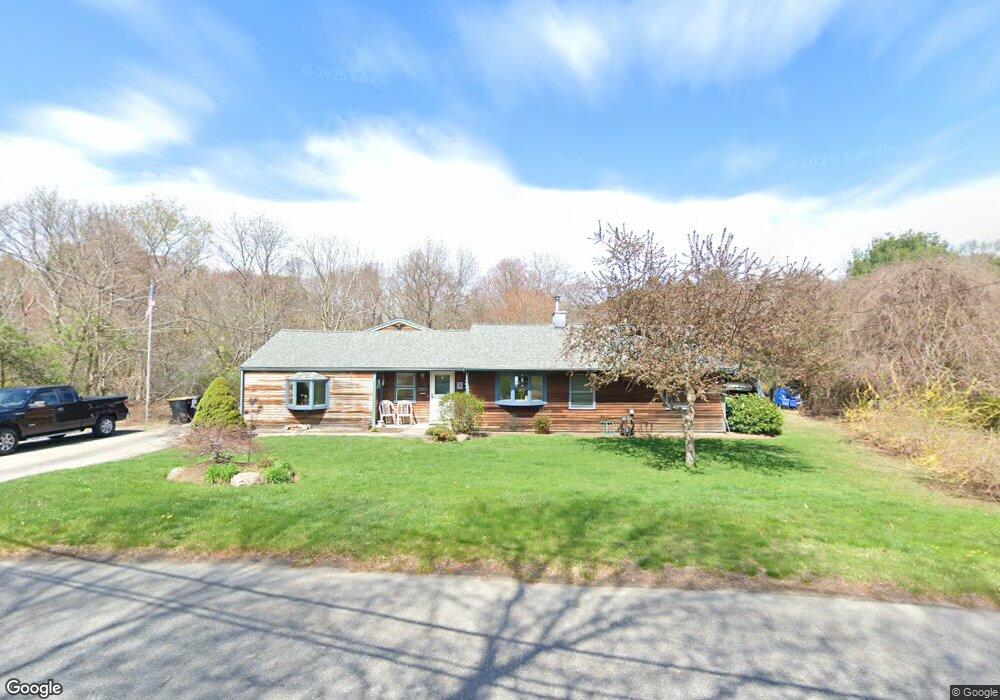
45 Janebar Cir Framingham, MA 01701
Nobscot NeighborhoodEstimated Value: $622,000 - $791,000
4
Beds
2
Baths
2,246
Sq Ft
$311/Sq Ft
Est. Value
About This Home
This home is located at 45 Janebar Cir, Framingham, MA 01701 and is currently estimated at $698,216, approximately $310 per square foot. 45 Janebar Cir is a home located in Middlesex County with nearby schools including Framingham High School, MetroWest Jewish Day School, and Sudbury Valley School.
Ownership History
Date
Name
Owned For
Owner Type
Purchase Details
Closed on
Jan 16, 1991
Sold by
Bancboston Mtg Corp
Bought by
Gallagher Rickey H and Gallagher Elizabeth
Current Estimated Value
Purchase Details
Closed on
Oct 5, 1990
Sold by
Zykowski Thomas
Bought by
Bancboston Mtg Corp
Create a Home Valuation Report for This Property
The Home Valuation Report is an in-depth analysis detailing your home's value as well as a comparison with similar homes in the area
Home Values in the Area
Average Home Value in this Area
Purchase History
| Date | Buyer | Sale Price | Title Company |
|---|---|---|---|
| Gallagher Rickey H | $102,500 | -- | |
| Gallagher Rickey H | $102,500 | -- | |
| Bancboston Mtg Corp | $95,000 | -- | |
| Bancboston Mtg Corp | $95,000 | -- |
Source: Public Records
Mortgage History
| Date | Status | Borrower | Loan Amount |
|---|---|---|---|
| Open | Bancboston Mtg Corp | $37,000 | |
| Closed | Bancboston Mtg Corp | $106,500 | |
| Closed | Bancboston Mtg Corp | $106,500 |
Source: Public Records
Tax History Compared to Growth
Tax History
| Year | Tax Paid | Tax Assessment Tax Assessment Total Assessment is a certain percentage of the fair market value that is determined by local assessors to be the total taxable value of land and additions on the property. | Land | Improvement |
|---|---|---|---|---|
| 2025 | $6,770 | $567,000 | $275,300 | $291,700 |
| 2024 | $6,503 | $521,900 | $245,900 | $276,000 |
| 2023 | $6,139 | $469,000 | $219,500 | $249,500 |
| 2022 | $5,834 | $424,600 | $199,100 | $225,500 |
| 2021 | $5,657 | $402,600 | $191,400 | $211,200 |
| 2020 | $5,677 | $379,000 | $173,900 | $205,100 |
| 2019 | $5,380 | $349,800 | $173,900 | $175,900 |
| 2018 | $5,275 | $323,200 | $167,400 | $155,800 |
| 2017 | $5,210 | $311,800 | $162,600 | $149,200 |
| 2016 | $5,124 | $294,800 | $162,600 | $132,200 |
| 2015 | $5,209 | $292,300 | $162,300 | $130,000 |
Source: Public Records
Map
Nearby Homes