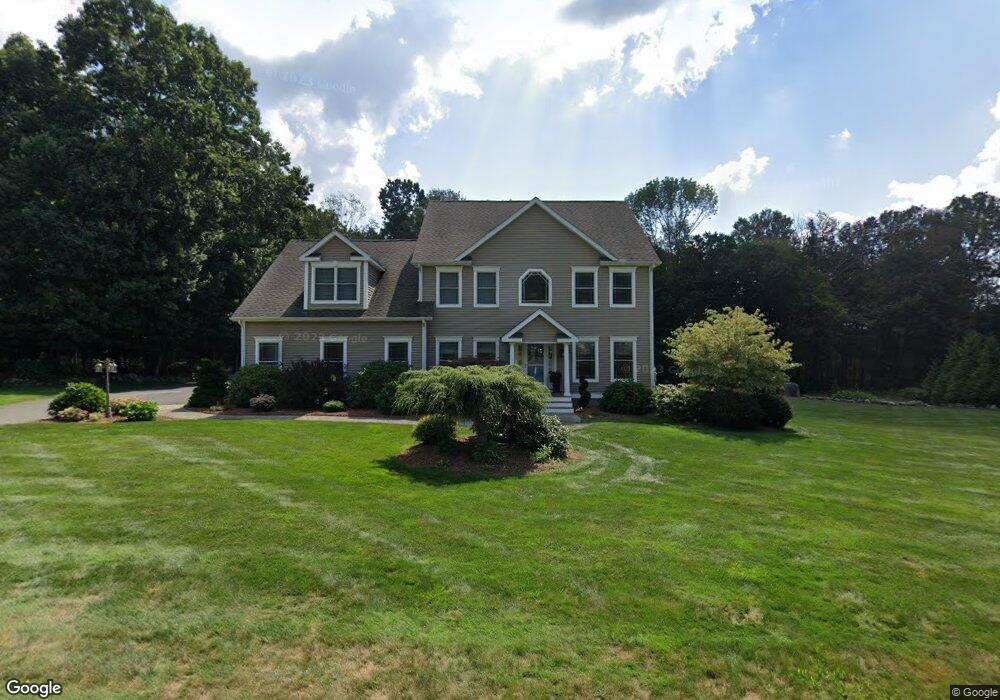
45 Josiah Ln Tolland, CT 06084
Estimated Value: $658,000 - $728,330
4
Beds
3
Baths
2,813
Sq Ft
$246/Sq Ft
Est. Value
About This Home
This home is located at 45 Josiah Ln, Tolland, CT 06084 and is currently estimated at $691,083, approximately $245 per square foot. 45 Josiah Ln is a home located in Tolland County with nearby schools including Birch Grove Primary School, Tolland Intermediate School, and Tolland Middle School.
Ownership History
Date
Name
Owned For
Owner Type
Purchase Details
Closed on
Nov 14, 2007
Sold by
Jk Custom Homes Llc
Bought by
Percy Cory and Percy Keith
Current Estimated Value
Purchase Details
Closed on
Jun 11, 2007
Sold by
Capstone Builders Inc
Bought by
Jk Custom Homes Llc
Create a Home Valuation Report for This Property
The Home Valuation Report is an in-depth analysis detailing your home's value as well as a comparison with similar homes in the area
Home Values in the Area
Average Home Value in this Area
Purchase History
| Date | Buyer | Sale Price | Title Company |
|---|---|---|---|
| Percy Cory | $535,000 | -- | |
| Percy Cory | $535,000 | -- | |
| Jk Custom Homes Llc | $135,000 | -- | |
| Jk Custom Homes Llc | $135,000 | -- |
Source: Public Records
Mortgage History
| Date | Status | Borrower | Loan Amount |
|---|---|---|---|
| Open | Jk Custom Homes Llc | $380,000 | |
| Closed | Jk Custom Homes Llc | $398,648 | |
| Closed | Jk Custom Homes Llc | $417,000 |
Source: Public Records
Tax History Compared to Growth
Tax History
| Year | Tax Paid | Tax Assessment Tax Assessment Total Assessment is a certain percentage of the fair market value that is determined by local assessors to be the total taxable value of land and additions on the property. | Land | Improvement |
|---|---|---|---|---|
| 2025 | $13,141 | $483,300 | $92,500 | $390,800 |
| 2024 | $7,327 | $194,000 | $88,100 | $105,900 |
| 2023 | $7,242 | $194,000 | $88,100 | $105,900 |
| 2022 | $7,097 | $194,000 | $88,100 | $105,900 |
| 2021 | $7,199 | $194,000 | $88,100 | $105,900 |
| 2020 | $6,994 | $194,000 | $88,100 | $105,900 |
| 2019 | $11,875 | $329,400 | $90,800 | $238,600 |
| 2018 | $11,529 | $329,400 | $90,800 | $238,600 |
| 2017 | $11,262 | $329,400 | $90,800 | $238,600 |
| 2016 | $11,262 | $329,400 | $90,800 | $238,600 |
| 2015 | $10,989 | $329,400 | $90,800 | $238,600 |
| 2014 | $10,920 | $351,700 | $100,900 | $250,800 |
Source: Public Records
Map
Nearby Homes