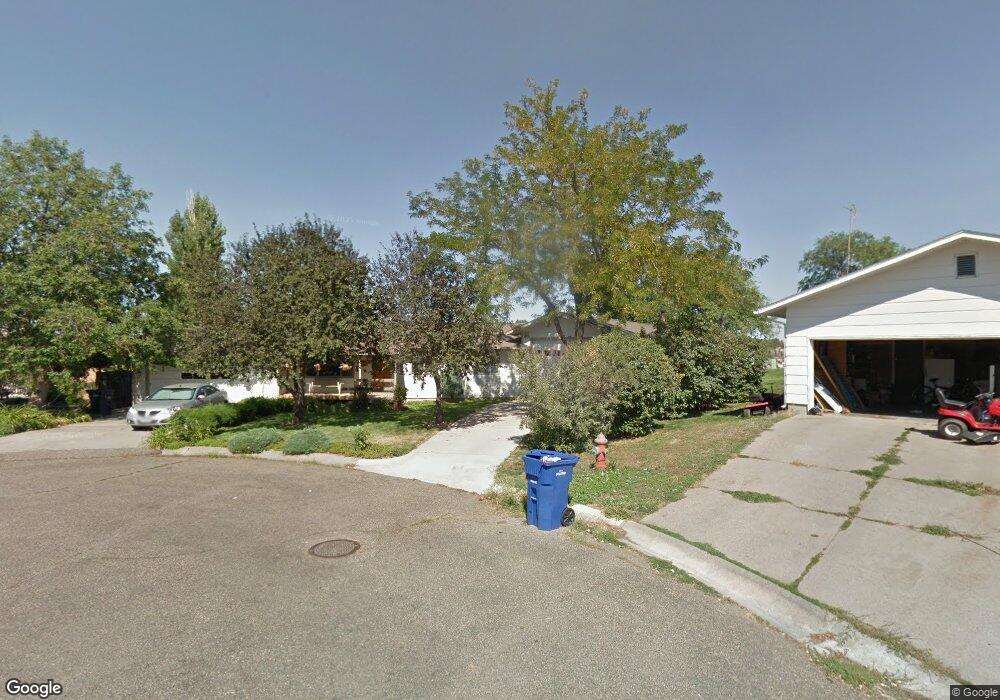
45 Juniper Ave Colstrip, MT 59323
Estimated Value: $193,000 - $234,000
3
Beds
1
Bath
1,260
Sq Ft
$175/Sq Ft
Est. Value
About This Home
This home is located at 45 Juniper Ave, Colstrip, MT 59323 and is currently estimated at $220,057, approximately $174 per square foot. 45 Juniper Ave is a home located in Rosebud County with nearby schools including Pine Butte Elementary School and Frank Brattin Middle School.
Ownership History
Date
Name
Owned For
Owner Type
Purchase Details
Closed on
Feb 27, 2017
Sold by
Kyle Ronald L and Kyle Kimberly K
Bought by
Hanser Melissa and Hanser Thomas
Current Estimated Value
Home Financials for this Owner
Home Financials are based on the most recent Mortgage that was taken out on this home.
Original Mortgage
$196,969
Outstanding Balance
$160,582
Interest Rate
4.09%
Mortgage Type
New Conventional
Estimated Equity
$59,475
Purchase Details
Closed on
Aug 21, 1995
Bought by
Hanser Melissa and Hanser Thomas
Home Financials for this Owner
Home Financials are based on the most recent Mortgage that was taken out on this home.
Original Mortgage
$196,969
Interest Rate
7.71%
Mortgage Type
New Conventional
Create a Home Valuation Report for This Property
The Home Valuation Report is an in-depth analysis detailing your home's value as well as a comparison with similar homes in the area
Purchase History
| Date | Buyer | Sale Price | Title Company |
|---|---|---|---|
| Hanser Melissa | $246,211 | -- | |
| Hanser Melissa | $246,211 | -- | |
| Hanser Thomas | -- | None Available | |
| Hanser Melissa | $246,211 | -- |
Source: Public Records
Mortgage History
| Date | Status | Borrower | Loan Amount |
|---|---|---|---|
| Open | Hanser Thomas | $196,969 | |
| Closed | Hanser Melissa | $196,969 | |
| Previous Owner | Hanser Melissa | $196,969 |
Source: Public Records
Tax History
| Year | Tax Paid | Tax Assessment Tax Assessment Total Assessment is a certain percentage of the fair market value that is determined by local assessors to be the total taxable value of land and additions on the property. | Land | Improvement |
|---|---|---|---|---|
| 2025 | $1,046 | $186,343 | $0 | $0 |
| 2024 | $1,406 | $171,400 | $0 | $0 |
| 2023 | $1,341 | $171,400 | $0 | $0 |
| 2022 | $1,094 | $151,500 | $0 | $0 |
| 2021 | $1,097 | $151,500 | $0 | $0 |
| 2020 | $990 | $155,700 | $0 | $0 |
| 2019 | $875 | $155,700 | $0 | $0 |
| 2018 | $930 | $170,400 | $0 | $0 |
| 2017 | $675 | $168,800 | $0 | $0 |
| 2016 | $838 | $163,700 | $0 | $0 |
| 2015 | $574 | $163,700 | $0 | $0 |
| 2014 | $379 | $65,879 | $0 | $0 |
Source: Public Records
Map
Nearby Homes
Your Personal Tour Guide
Ask me questions while you tour the home.