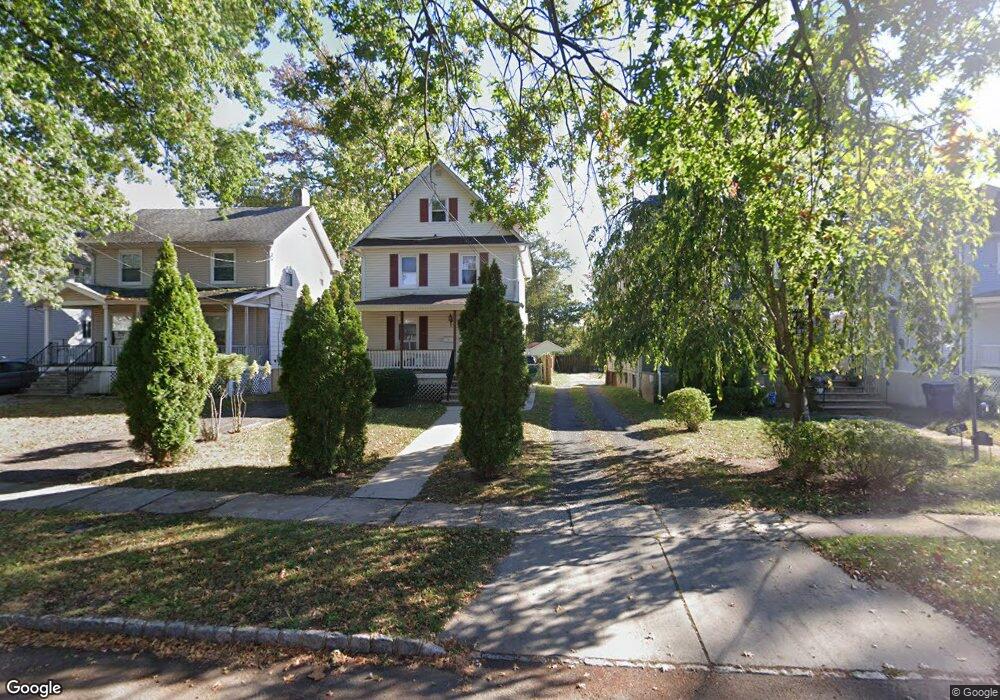
45 Laramie Rd Unit 47 Plainfield, NJ 07060
Estimated Value: $396,000 - $458,000
--
Bed
--
Bath
1,272
Sq Ft
$331/Sq Ft
Est. Value
About This Home
This home is located at 45 Laramie Rd Unit 47, Plainfield, NJ 07060 and is currently estimated at $421,093, approximately $331 per square foot. 45 Laramie Rd Unit 47 is a home located in Union County with nearby schools including Cedarbrook K-8 Center, Hubbard Middle School, and Plainfield High School.
Ownership History
Date
Name
Owned For
Owner Type
Purchase Details
Closed on
Jun 14, 2011
Sold by
Thompson Mary
Bought by
Thompson Mary and Dobson Lynbergh
Current Estimated Value
Purchase Details
Closed on
Oct 23, 2005
Sold by
Holmes Pearl E
Bought by
Thompson Mary
Home Financials for this Owner
Home Financials are based on the most recent Mortgage that was taken out on this home.
Original Mortgage
$207,920
Interest Rate
6.33%
Purchase Details
Closed on
Aug 5, 2003
Sold by
Holmes Pearl E
Bought by
Holmes Pearl E
Purchase Details
Closed on
Jul 28, 1998
Sold by
Thompson Lambert and Thompson Selina
Bought by
Holmes Pearl E and Lynch Andre
Home Financials for this Owner
Home Financials are based on the most recent Mortgage that was taken out on this home.
Original Mortgage
$70,410
Interest Rate
6.92%
Mortgage Type
FHA
Create a Home Valuation Report for This Property
The Home Valuation Report is an in-depth analysis detailing your home's value as well as a comparison with similar homes in the area
Home Values in the Area
Average Home Value in this Area
Purchase History
| Date | Buyer | Sale Price | Title Company |
|---|---|---|---|
| Thompson Mary | -- | None Available | |
| Thompson Mary | $259,900 | -- | |
| Holmes Pearl E | -- | -- | |
| Holmes Pearl E | $71,000 | -- |
Source: Public Records
Mortgage History
| Date | Status | Borrower | Loan Amount |
|---|---|---|---|
| Previous Owner | Thompson Mary | $207,920 | |
| Previous Owner | Holmes Pearl E | $70,410 |
Source: Public Records
Tax History Compared to Growth
Tax History
| Year | Tax Paid | Tax Assessment Tax Assessment Total Assessment is a certain percentage of the fair market value that is determined by local assessors to be the total taxable value of land and additions on the property. | Land | Improvement |
|---|---|---|---|---|
| 2025 | $7,911 | $90,600 | $32,000 | $58,600 |
| 2024 | $7,833 | $90,600 | $32,000 | $58,600 |
| 2023 | $7,833 | $90,600 | $32,000 | $58,600 |
| 2022 | $7,664 | $90,600 | $32,000 | $58,600 |
| 2021 | $7,597 | $90,600 | $32,000 | $58,600 |
| 2020 | $7,575 | $90,600 | $32,000 | $58,600 |
| 2019 | $7,575 | $90,600 | $32,000 | $58,600 |
| 2018 | $7,417 | $90,600 | $32,000 | $58,600 |
| 2017 | $7,235 | $90,600 | $32,000 | $58,600 |
| 2016 | $7,088 | $90,600 | $32,000 | $58,600 |
| 2015 | $6,878 | $90,600 | $32,000 | $58,600 |
| 2014 | -- | $90,600 | $32,000 | $58,600 |
Source: Public Records
Map
Nearby Homes
- 1208 Moffett Ave Unit 12
- 1339 Park Ave Unit 41
- 1349 Park Ave Unit 53
- 115 Ellsworth Ct Unit 17
- 77 Parkside Rd Unit 89
- 1143 Stilford Ave Unit 45
- 1143-45 Stilford Ave
- 132 Parkside Rd
- 1066 Allenwood Dr
- 1360 Belleview Ave Unit 64
- 1388 Belleview Ave Unit 90
- 127 Remington Ave Unit 31
- 1358 Marlborough Ave Unit 60
- 1454 S End Pkwy Unit 56
- 1354 Chetwynd Ave Unit 58
- 117 Golf Ave E
- 1028 Evergreen Ave
- 1400 Kenyon Ave
- 946 Central Ave
- 221 Golf Ave E
- 49 Laramie Rd Unit 51
- 43 Laramie Rd
- 39 Laramie Rd Unit 41
- 53 Laramie Rd
- 55 Laramie Rd Unit 57
- 37 Laramie Rd
- 1246 Lenox Ave Unit 48
- 1248 Lenox Ave
- 33 Laramie Rd Unit 35
- 59 Laramie Rd
- 52 Laramie Rd Unit 54
- 1295 Arlington Ave
- 1242 Lenox Ave Unit 44
- 1297 Arlington Ave Unit 99
- 1293 Arlington Ave
- 1242-44 Lenox Ave
- 61 Laramie Rd Unit 63
- 1249 Cameron Ave Unit 51
- 29 Laramie Rd Unit 31
- 65 Laramie Rd