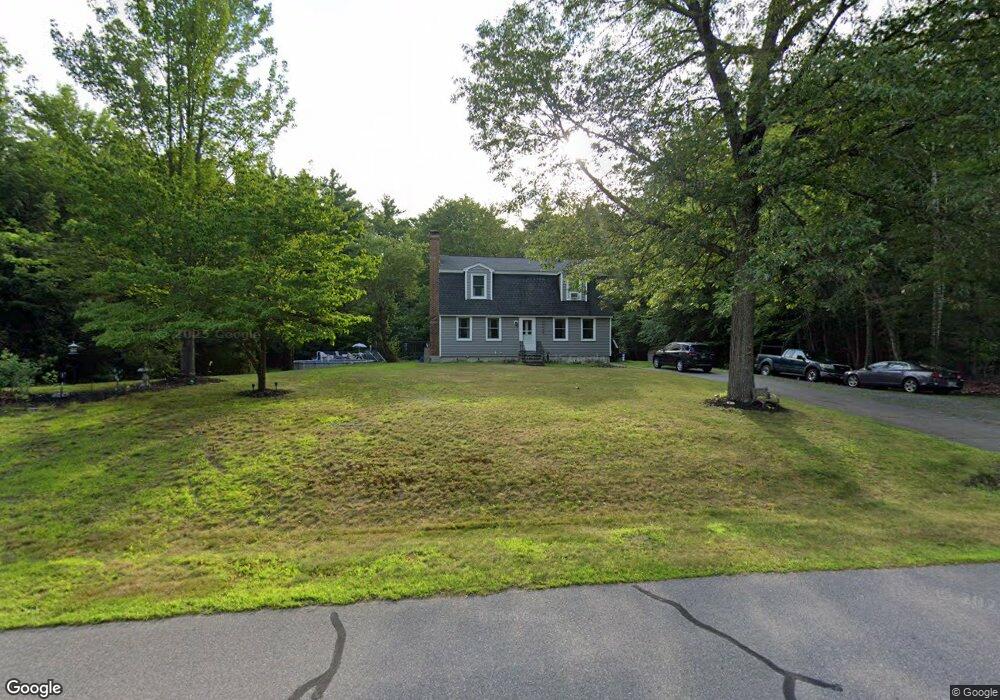
45 Marty Dr Merrimack, NH 03054
Estimated Value: $556,256 - $649,000
3
Beds
2
Baths
1,843
Sq Ft
$321/Sq Ft
Est. Value
About This Home
This home is located at 45 Marty Dr, Merrimack, NH 03054 and is currently estimated at $592,064, approximately $321 per square foot. 45 Marty Dr is a home located in Hillsborough County with nearby schools including James Mastricola Elementary School, Merrimack Middle School, and James Mastricola Upper Elementary School.
Ownership History
Date
Name
Owned For
Owner Type
Purchase Details
Closed on
Aug 3, 2012
Sold by
Hutchhinson Jason D and Hutchinson Michaelle M
Bought by
Hutchinson Michaelle
Current Estimated Value
Home Financials for this Owner
Home Financials are based on the most recent Mortgage that was taken out on this home.
Original Mortgage
$197,406
Outstanding Balance
$136,946
Interest Rate
3.7%
Mortgage Type
Purchase Money Mortgage
Estimated Equity
$455,118
Purchase Details
Closed on
Jul 24, 2007
Sold by
Cohen Bruce L
Bought by
Hutchinson Jason D and Hutchinson Michelle M
Home Financials for this Owner
Home Financials are based on the most recent Mortgage that was taken out on this home.
Original Mortgage
$213,000
Interest Rate
6.54%
Mortgage Type
Purchase Money Mortgage
Create a Home Valuation Report for This Property
The Home Valuation Report is an in-depth analysis detailing your home's value as well as a comparison with similar homes in the area
Home Values in the Area
Average Home Value in this Area
Purchase History
| Date | Buyer | Sale Price | Title Company |
|---|---|---|---|
| Hutchinson Michaelle | -- | -- | |
| Hutchinson Jason D | $288,000 | -- |
Source: Public Records
Mortgage History
| Date | Status | Borrower | Loan Amount |
|---|---|---|---|
| Open | Hutchinson Michaelle | $197,406 | |
| Previous Owner | Hutchinson Jason D | $208,000 | |
| Previous Owner | Hutchinson Jason D | $213,000 |
Source: Public Records
Tax History Compared to Growth
Tax History
| Year | Tax Paid | Tax Assessment Tax Assessment Total Assessment is a certain percentage of the fair market value that is determined by local assessors to be the total taxable value of land and additions on the property. | Land | Improvement |
|---|---|---|---|---|
| 2024 | $8,309 | $401,600 | $228,400 | $173,200 |
| 2023 | $7,811 | $401,600 | $228,400 | $173,200 |
| 2022 | $6,980 | $401,600 | $228,400 | $173,200 |
| 2021 | $6,895 | $401,600 | $228,400 | $173,200 |
| 2020 | $6,953 | $289,000 | $160,000 | $129,000 |
| 2019 | $6,974 | $289,000 | $160,000 | $129,000 |
| 2018 | $6,971 | $289,000 | $160,000 | $129,000 |
| 2017 | $6,710 | $287,100 | $160,000 | $127,100 |
| 2016 | $6,543 | $287,100 | $160,000 | $127,100 |
| 2015 | $6,647 | $268,900 | $148,600 | $120,300 |
| 2014 | $6,478 | $268,900 | $148,600 | $120,300 |
| 2013 | $6,429 | $268,900 | $148,600 | $120,300 |
Source: Public Records
Map
Nearby Homes